Philips 2013 Annual Report Download - page 163
Download and view the complete annual report
Please find page 163 of the 2013 Philips annual report below. You can navigate through the pages in the report by either clicking on the pages listed below, or by using the keyword search tool below to find specific information within the annual report.-
 1
1 -
2
-
3
-
4
-
5
-
6
-
7
-
8
-
9
-
10
-
11
-
12
-
13
-
14
-
15
-
16
-
17
-
18
-
19
-
20
-
21
-
22
-
23
-
24
-
25
-
26
-
27
-
28
-
29
-
30
-
31
-
32
-
33
-
34
-
35
-
36
-
37
-
38
-
39
-
40
-
41
-
42
-
43
-
44
-
45
-
46
-
47
-
48
-
49
-
50
-
51
-
52
-
53
-
54
-
55
-
56
-
57
-
58
-
59
-
60
-
61
-
62
-
63
-
64
-
65
-
66
-
67
-
68
-
69
-
70
-
71
-
72
-
73
-
74
-
75
-
76
-
77
-
78
-
79
-
80
-
81
-
82
-
83
-
84
-
85
-
86
-
87
-
88
-
89
-
90
-
91
-
92
-
93
-
94
-
95
-
96
-
97
-
98
-
99
-
100
-
101
-
102
-
103
-
104
-
105
-
106
-
107
-
108
-
109
-
110
-
111
-
112
-
113
-
114
-
115
-
116
-
117
-
118
-
119
-
120
-
121
-
122
-
123
-
124
-
125
-
126
-
127
-
128
-
129
-
130
-
131
-
132
-
133
-
134
-
135
-
136
-
137
-
138
-
139
-
140
-
141
-
142
-
143
-
144
-
145
-
146
-
147
-
148
-
149
-
150
-
151
-
152
-
 153
153 -
 154
154 -
 155
155 -
 156
156 -
 157
157 -
 158
158 -
 159
159 -
 160
160 -
 161
161 -
 162
162 -
 163
163 -
 164
164 -
 165
165 -
 166
166 -
 167
167 -
 168
168 -
 169
169 -
 170
170 -
 171
171 -
 172
172 -
 173
173 -
174
-
175
-
176
-
177
-
178
-
179
-
180
-
181
-
182
-
183
-
184
-
185
-
186
-
187
-
188
-
189
-
190
-
191
-
192
-
193
-
194
-
195
-
196
-
197
-
198
-
199
-
200
-
201
-
202
-
203
-
204
-
205
-
206
-
207
-
208
-
209
-
210
-
211
-
212
-
213
-
214
-
215
-
216
-
217
-
218
-
219
-
220
-
221
-
222
-
223
-
224
-
225
-
226
-
227
-
228
-
229
-
230
-
231
-
232
-
233
-
234
-
235
-
236
-
237
-
238
-
239
-
240
-
241
-
242
-
243
-
244
-
245
-
246
-
247
-
248
-
249
-
250
 |
 |

11 Group financial statements 11.9 - 11.9 19
Annual Report 2013 163
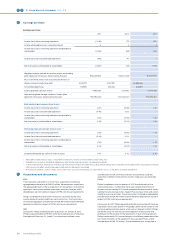
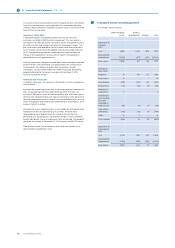
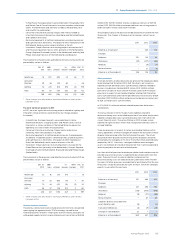
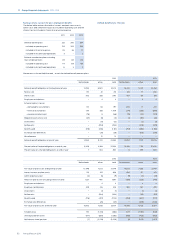
The changes in the allowance for doubtful accounts receivable are as
follows:
2011 2012 2013
Balance as of January 1 264 233 202
Additions charged to income 20 11 24
Deductions from allowance1) (31) (43) (23)
Other movements (20) 1 (21)
Balance as of December 31 233 202 182
1) Write-os for which an allowance was previously provided
19 Equity
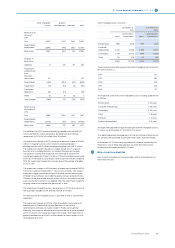
Common shares
As of December 31, 2013, the issued and fully paid share capital consists of
937,845,789 common shares, each share having a par value of EUR 0.20.
In June 2013, Philips settled a dividend of EUR 0.75 per common share,
representing a total value of EUR 678 million. Shareholders could elect for
a cash dividend or a share dividend. Approximately 59.8% of the
shareholders elected for a share dividend, resulting in the issuance of
18,491,337 new common shares. The settlement of the cash dividend
resulted in a payment of EUR 272 million.
The following table shows the movements in the outstanding number of
shares;
Share movement schedule
2012 2013
Balance as of January 1 926,094,902 914,591,275
Dividend distributed 30,522,107 18,491,337
Purchase of treasury shares (46,870,632) (27,811,356)
Re-issuance of treasury
shares 4,844,898 8,066,511
Balance as of December 31 914,591,275 913,337,767
Preference shares
The ‘Stichting Preferente Aandelen Philips’ has been granted the right to
acquire preference shares in the Company. Such right has not been
exercised. As a means to protect the Company and its stakeholders
against an unsolicited attempt to acquire (de facto) control of the
Company, the General Meeting of Shareholders in 1989 adopted
amendments to the Company’s articles of association that allow the Board
of Management and the Supervisory Board to issue (rights to acquire)
preference shares to a third party. As of December 31, 2013, no preference
shares have been issued.
Option rights/restricted shares
The Company has granted stock options on its common shares and rights
to receive common shares in the future (see note 31, Share-based
compensation).
Treasury shares
In connection with the Company’s share repurchase programs, shares
which have been repurchased and are held in treasury for (i) delivery upon
exercise of options, performance and restricted share programs and
employee share purchase programs, and (ii) capital reduction purposes,
are accounted for as a reduction of shareholders’ equity. Treasury shares
are recorded at cost, representing the market price on the acquisition date.
When issued, shares are removed from treasury shares on a first-in, first-
out (FIFO) basis.
Any dierence between the cost and the cash received at the time treasury
shares are issued, is recorded in retained earnings.
Dividend withholding tax in connection with the Company’s purchase of
treasury shares is recorded in retained earnings.
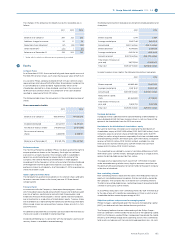
The following transactions took place resulting from employee option and
share plans:
2012 2013
Shares acquired 5,147 3,984
Average market price EUR 17.86 EUR 22.51
Amount paid EUR 0 million EUR 0 million
Shares delivered 4,844,898 8,066,511
Average market price EUR 24.39 EUR 28.35
Amount received EUR 118 million EUR 229 million
Total shares in treasury at
year-end 28,712,954 20,650,427
Total cost EUR 847 million EUR 618 million
In order to reduce share capital, the following transactions took place:
2012 2013
Shares acquired 46,865,485 27,807,372
Average market price EUR 16.41 EUR 22.69
Amount paid EUR 769 million EUR 631 million
Reduction of capital
stock 82,364,590 37,778,510
Total shares in treasury at
year-end 13,828,733 3,857,595
Total cost EUR 256 million EUR 100 million
Dividend distribution
A proposal will be submitted to the General Meeting of Shareholders to
pay a dividend of EUR 0.80 per common share, in cash or shares at the
option of the shareholder from the 2013 net income.
Limitations in the distribution of shareholders’ equity
Pursuant to Dutch law, limitations exist relating to the distribution of
shareholders’ equity of EUR 1,609 million (2012: EUR 1,480 million). Such
limitations relate to common shares of EUR 188 million (2012: EUR 191
million) as well as to legal reserves required by Dutch law included under
retained earnings of EUR 1,319 million (2012: EUR 1,161 million), revaluation
reserves of EUR 23 million (2012: EUR 54 million), available-for-sale
financial assets EUR 55 million (2012: EUR 54 million) and cash flow
hedges EUR 24 million (2012: EUR 20 million).
The unrealized losses related to currency translation dierences of EUR
569 million (2012: EUR 93 million), although qualifying as a legal reserve,
reduce the distributable amount by their nature.
The legal reserve required by Dutch law of EUR 1,319 million included
under retained earnings relates to any legal or economic restrictions on
the ability of affiliated companies to transfer funds to the parent company
in the form of dividends.
Non-controlling interests
Non-controlling interests represent the claims that third parties have on
equity of consolidated group companies that are not wholly-owned by
the Company. The Company has no material non-controlling interests.
The Net income attributable to non-controlling interests amounted to EUR
3 million in 2013 (2012: EUR 5 million).
In 2013 Philips reduced its non-controlling interest by EUR 19 million due
to the sale of one of its Healthcare subsidiaries in China in which a local
shareholder held an ownership percentage of 49%.
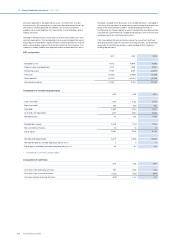
Objectives, policies and processes for managing capital
Philips manages capital based upon the measures net operating capital
(NOC), net debt and cash flows before financing activities.
The Company believes that an understanding of the Philips Group’s
financial condition is enhanced by the disclosure of net operating capital
(NOC), as this figure is used by Philips’ management to evaluate the capital
efficiency of the Philips Group and its operating sectors. NOC is defined as:
total assets excluding assets from discontinued operations less: (a) cash