Philips 2013 Annual Report Download - page 200
Download and view the complete annual report
Please find page 200 of the 2013 Philips annual report below. You can navigate through the pages in the report by either clicking on the pages listed below, or by using the keyword search tool below to find specific information within the annual report.-
 1
1 -
2
-
3
-
4
-
5
-
6
-
7
-
8
-
9
-
10
-
11
-
12
-
13
-
14
-
15
-
16
-
17
-
18
-
19
-
20
-
21
-
22
-
23
-
24
-
25
-
26
-
27
-
28
-
29
-
30
-
31
-
32
-
33
-
34
-
35
-
36
-
37
-
38
-
39
-
40
-
41
-
42
-
43
-
44
-
45
-
46
-
47
-
48
-
49
-
50
-
51
-
52
-
53
-
54
-
55
-
56
-
57
-
58
-
59
-
60
-
61
-
62
-
63
-
64
-
65
-
66
-
67
-
68
-
69
-
70
-
71
-
72
-
73
-
74
-
75
-
76
-
77
-
78
-
79
-
80
-
81
-
82
-
83
-
84
-
85
-
86
-
87
-
88
-
89
-
90
-
91
-
92
-
93
-
94
-
95
-
96
-
97
-
98
-
99
-
100
-
101
-
102
-
103
-
104
-
105
-
106
-
107
-
108
-
109
-
110
-
111
-
112
-
113
-
114
-
115
-
116
-
117
-
118
-
119
-
120
-
121
-
122
-
123
-
124
-
125
-
126
-
127
-
128
-
129
-
130
-
131
-
132
-
133
-
134
-
135
-
136
-
137
-
138
-
139
-
140
-
141
-
142
-
143
-
144
-
145
-
146
-
147
-
148
-
149
-
150
-
151
-
152
-
153
-
154
-
155
-
156
-
157
-
158
-
159
-
160
-
161
-
162
-
163
-
164
-
165
-
166
-
167
-
168
-
169
-
170
-
171
-
172
-
173
-
174
-
175
-
176
-
177
-
178
-
179
-
180
-
181
-
182
-
183
-
184
-
185
-
186
-
187
-
188
-
189
-
 190
190 -
 191
191 -
 192
192 -
 193
193 -
 194
194 -
 195
195 -
 196
196 -
 197
197 -
 198
198 -
 199
199 -
 200
200 -
 201
201 -
 202
202 -
 203
203 -
 204
204 -
 205
205 -
 206
206 -
 207
207 -
 208
208 -
 209
209 -
 210
210 -
211
-
212
-
213
-
214
-
215
-
216
-
217
-
218
-
219
-
220
-
221
-
222
-
223
-
224
-
225
-
226
-
227
-
228
-
229
-
230
-
231
-
232
-
233
-
234
-
235
-
236
-
237
-
238
-
239
-
240
-
241
-
242
-
243
-
244
-
245
-
246
-
247
-
248
-
249
-
250
 |
 |

13 Sustainability statements 13 - 13
200 Annual Report 2013
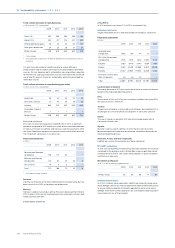
The emissions of substances data is based on measurements and
estimates at manufacturing site level. There is therefore an inherent
uncertainty in our calculations. The figures reported are Philips’ best
estimate. As our insight increases, we may enhance the methodology in
the future.
Integration of newly acquired activities is scheduled according to a
defined integration timetable (in principle, first full reporting year after the
year of acquisition) and subject to the integration agenda. Data for
activities that are divested during the reporting year are not included in
full-year reporting. Environmental data are reported for manufacturing
sites with more than 50 industrial employees.
Social data cover all employees, including temporary employees, but
exclude contract workers. Due to the implementation of new HRM
systems, we are able to provide exit diversity information on Philips
employees as from 2012. Historical comparisons may not be available,
however.
Health and safety data is reported for units with over 50 FTEs (full-time
equivalents) and is voluntary for smaller units. New acquisitions must
report, in principle, the first year after acquisition and subject to the
integration agenda. Data for activities that are divested during the
reporting year are not included in full-year reporting.
In line with the discontinued operations presentation in the Group
financial statements regarding the Audio, Video, Multimedia and
Accessories (AVM&A) business, we have excluded the AVM&A data from
the consolidated Sustainability data. Where the impact of the exclusion
was material, we clearly disclosed the impact.
Prior-period financial statements have been restated for the treatment of
Audio, Video, Multimedia and Accessories as discontinued operations and
the adoption of IAS 19R, which mainly relates to accounting for pensions.
Data definitions and scope
Lives improved, energy efficiency and materials
The key performance indicators on ‘lives improved’, ‘energy efficiency’
and ‘materials’ and the scope are defined in the respective methodology
documents that can be found at www.philips.com/sustainability.
Green Products
Green Products oer a significant environmental improvement in one or
more Green Focal Areas: Energy efficiency, Packaging, Hazardous
substances, Weight, Recycling and disposal and Lifetime reliability. The
life cycle approach is used to determine a product’s overall environmental
improvement. It calculates the environmental impact of a product over its
total life cycle (raw materials, manufacturing, product use and disposal).
Green Products need to prove leadership in at least one Green Focal Area
compared to industry standards, which is defined by a sector specific peer
group. This is done either by outperforming reference products (which can
be a competitor or predecessor product in the particular product family)
by at least 10%, outperforming product-specific eco-requirements or by
being awarded with a recognized eco-performance label. Because of
dierent product portfolios, sectors have specified additional criteria for
Green Products, including product-specific minimum requirements where
relevant.
Green Innovation
Green Innovation comprise all R&D activities directly contributing to the
development of Green Products or Green Technologies. A wide set of
additional criteria and boundaries have been defined as the basis for
internal and external validation.
Environmental data
All environmental data from manufacturing operations are reported on a
half-year basis in our sustainability reporting and validation tool,
according to defined company guidelines that include definitions,
procedures and calculation methods.
Internal validation processes are followed and peer audits performed to
ensure consistent data quality and to assess the robustness of data
reporting systems.
These environmental data from manufacturing are tracked and reported
to measure progress against our Green operations program targets.
Reporting on ISO 14001 certification is based on manufacturing units
reporting in the sustainability reporting system.
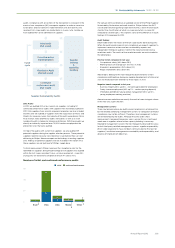
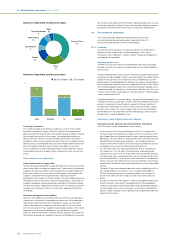
Operational carbon footprint
The Philips operational carbon footprint (Scope 1, 2 and 3) is calculated on
a half-yearly basis and includes:
• Industrial sites – manufacturing and assembly sites
• Non-industrial sites – offices, warehouses, IT centers and R&D facilities
• Business travel – lease and rental cars and airplane travel
• Logistics – air, sea and road transport
All emission factors used to transform input data (for example, amount of
tonne-kilometers transported) into CO2 emissions are from the
Greenhouse Gas Protocol (GHGP), except for business travel, where the
service providers supplied CO2 data based on their own verified
methodology. The GHGP distinguishes three scopes. It is mandatory to
report on the first two to comply with the GHGP reporting standards.
• Scope 1 – direct CO2 emissions – is reported on with direct emissions
from our industrial and non-industrial sites in full. Emissions from
industrial sites, which consist of direct emissions resulting from
processes and fossil fuel combustion on site, are reported in the
sustainability reporting system. Energy use and CO2 emissions from
non-industrial sites are based on actual data where available. If this is
not the case, they are estimated based on square meters, taking the
geographical location and building type of the site into account.
• Scope 2 – CO2 emissions resulting from the generation of purchased
electricity for our premises – is reported on with electricity use from
industrial and non-industrial sites in full. Indirect CO2 emissions
resulting from purchased electricity, steam and heat are reported in the
sustainability reporting system. Those emissions of industrial sites not
yet reporting are calculated on the same basis as described in Scope 1.
Indirect emissions of non-industrial sites are calculated in the same
manner as described in Scope 1.
• Scope 3 – other CO2 emissions related to activities not owned or
controlled by the Group is reported on for our business travel and
distribution activities. Commuting by our employees, upstream
distribution (before suppliers ship to us), outsourced activities and
emissions resulting from product use by our customers are not included
in our operational carbon footprint. The calculations for business travel
by lease cars are based on actual fuel usage and for rental cars on
distance traveled. Emissions from business travel by airplane are
calculated by the supplier based on mileage flown and emission
factors from DEFRA (UK Department of Environment, Food and Rural
Aairs), distinguishing between short, medium and long flights. Further,
emissions from air freight for distribution are calculated based on the
amount of tonne-kilometers transported between airports
(distinguishing between short, medium and long hauls), including an
estimate (based on actual data of the lanes with the largest volumes)
for trucking from sites and distribution centers to airports and vice
versa. Express shipments are generally a mix of road and air transport,
depending on the distance. Therefore the assumption is applied that
shipments over less than 600 km are transported by road and the rest
of the shipments by air (those emissions by air are calculated in the
same way as air freight). For sea transport, only data on transported
volume were available so an estimate had to be made about the
average weight of a container. Transportation to and from ports is not
registered. This fore and aft part of sea transport was estimated to be
around 3% of the total distance (based on actual data of the lanes with
the largest volumes), consisting of a mix of modalities, and was added
to the total emissions accordingly. CO2 emissions from road transport
were also calculated based on tonne-kilometers. If data were
incomplete, the emissions were estimated based on sales volumes.
Return travel of vehicles is not included in the data for sea and road
distribution.
Health and safety
Health and safety data are reported and validated monthly. The focus is
on reporting work-related injuries, which predominantly occur in
manufacturing operations. The annual number of cases leading to at least
one lost workday is reported per 100 FTEs (full-time equivalents).
Fatalities are reported for sta, contractors and visitors and include
commuting accidents.
General Business Principles
Alleged GBP violations are registered in our intranet-based reporting and
validation tool.
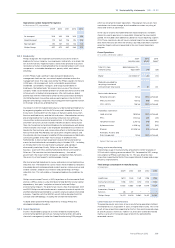
Supplier audits
Supplier audits are primarily focused on identified risk suppliers, based on
identified risk countries and on spend of more than EUR 1 million (new
suppliers EUR 100,000 and no threshold for high risk suppliers).