Philips 2013 Annual Report Download - page 172
Download and view the complete annual report
Please find page 172 of the 2013 Philips annual report below. You can navigate through the pages in the report by either clicking on the pages listed below, or by using the keyword search tool below to find specific information within the annual report.-
 1
1 -
2
-
3
-
4
-
5
-
6
-
7
-
8
-
9
-
10
-
11
-
12
-
13
-
14
-
15
-
16
-
17
-
18
-
19
-
20
-
21
-
22
-
23
-
24
-
25
-
26
-
27
-
28
-
29
-
30
-
31
-
32
-
33
-
34
-
35
-
36
-
37
-
38
-
39
-
40
-
41
-
42
-
43
-
44
-
45
-
46
-
47
-
48
-
49
-
50
-
51
-
52
-
53
-
54
-
55
-
56
-
57
-
58
-
59
-
60
-
61
-
62
-
63
-
64
-
65
-
66
-
67
-
68
-
69
-
70
-
71
-
72
-
73
-
74
-
75
-
76
-
77
-
78
-
79
-
80
-
81
-
82
-
83
-
84
-
85
-
86
-
87
-
88
-
89
-
90
-
91
-
92
-
93
-
94
-
95
-
96
-
97
-
98
-
99
-
100
-
101
-
102
-
103
-
104
-
105
-
106
-
107
-
108
-
109
-
110
-
111
-
112
-
113
-
114
-
115
-
116
-
117
-
118
-
119
-
120
-
121
-
122
-
123
-
124
-
125
-
126
-
127
-
128
-
129
-
130
-
131
-
132
-
133
-
134
-
135
-
136
-
137
-
138
-
139
-
140
-
141
-
142
-
143
-
144
-
145
-
146
-
147
-
148
-
149
-
150
-
151
-
152
-
153
-
154
-
155
-
156
-
157
-
158
-
159
-
160
-
161
-
 162
162 -
 163
163 -
 164
164 -
 165
165 -
 166
166 -
 167
167 -
 168
168 -
 169
169 -
 170
170 -
 171
171 -
 172
172 -
 173
173 -
 174
174 -
 175
175 -
 176
176 -
 177
177 -
 178
178 -
 179
179 -
 180
180 -
 181
181 -
 182
182 -
183
-
184
-
185
-
186
-
187
-
188
-
189
-
190
-
191
-
192
-
193
-
194
-
195
-
196
-
197
-
198
-
199
-
200
-
201
-
202
-
203
-
204
-
205
-
206
-
207
-
208
-
209
-
210
-
211
-
212
-
213
-
214
-
215
-
216
-
217
-
218
-
219
-
220
-
221
-
222
-
223
-
224
-
225
-
226
-
227
-
228
-
229
-
230
-
231
-
232
-
233
-
234
-
235
-
236
-
237
-
238
-
239
-
240
-
241
-
242
-
243
-
244
-
245
-
246
-
247
-
248
-
249
-
250
 |
 |
11 Group financial statements 11.9 - 11.9
172 Annual Report 2013
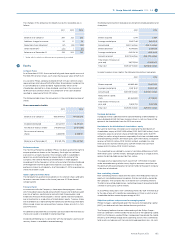
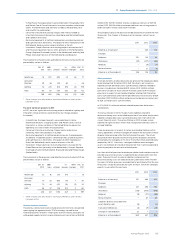
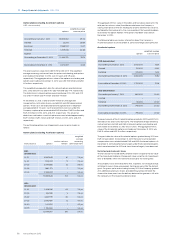
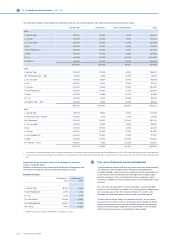
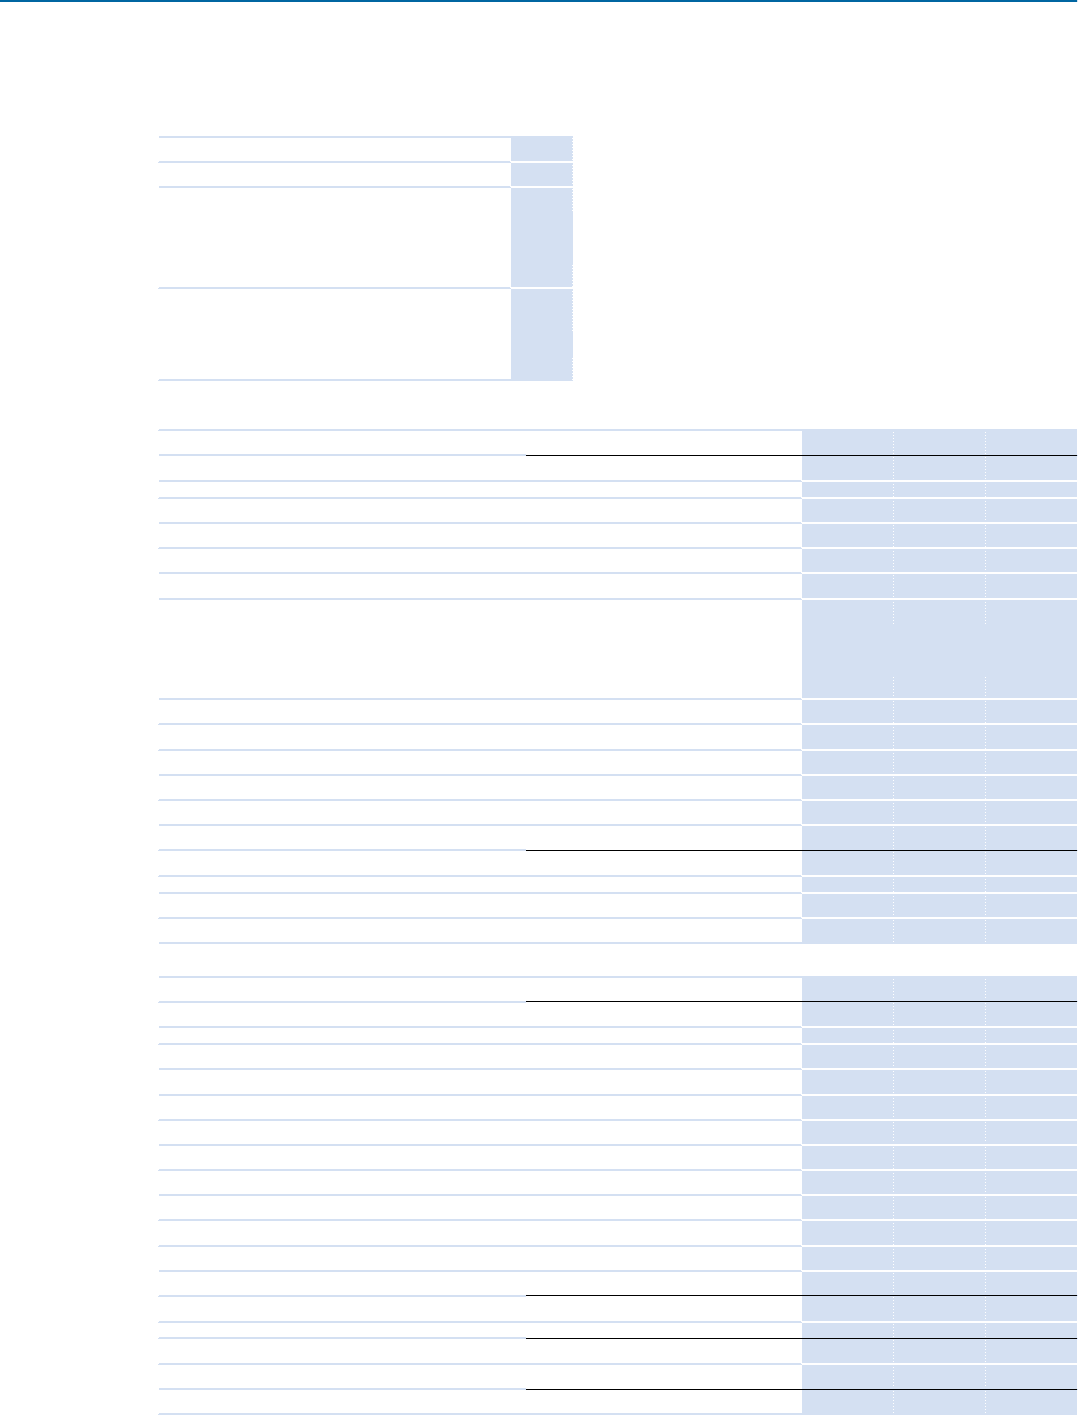
Summary of pre-tax costs for post-employment benefits
The below table contains the total of current- and past service costs,
admin costs and settlement results as included in operating cost and the
interest cost as included in financial income and expense.
2011 2012 2013
Defined-benefit plans 253 290 297
included in operating cost 155 205 223
included in financial expense 93 85 71
included in discontinued operations 5 − 3
Defined-contribution plans including
multi-employer plans 123 144 142
included in operating cost 117 139 139
included in discontinued operations 6 5 3
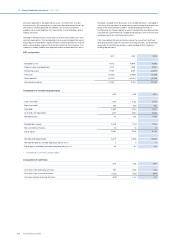
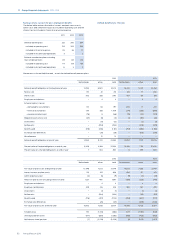
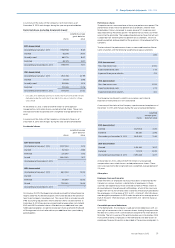
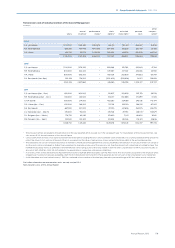
Defined-benefit plans: Pensions
Movements in the net liabilities and - assets for defined benefit pension plans:
2012 2013
Netherlands other total Netherlands other total
Defined-benefit obligation at the beginning of year 13,294 8,920 22,214 14,433 9,021 23,454
Service cost 170 81 251 183 77 260
Interest cost 502 388 890 467 351 818
Employee contributions − 4 4 − 4 4
Actuarial (gains) / losses
– demographic assumptions 133 64 197 205 17 222
– financial assumptions 1,151 358 1,509 (214) (385) (599)
– experience adjustment (76) 8 (68) (75) (32) (107)
(Negative) past service cost (25) (6) (31) (1) (80) (81)
Divestments − (13) (13) − (3) (3)
Settlements − (294) (294) − (279) (279)
Benefits paid (716) (465) (1,181) (704) (462) (1,166)
Exchange rate dierences − (36) (36) − (318) (318)
Miscellaneous − 12 12 − − −
Defined-benefit obligation at end of year 14,433 9,021 23,454 14,294 7,911 22,205
Present value of funded obligations at end of year 14,426 8,168 22,594 14,288 7,112 21,400
Present value of unfunded obligations at end of year 7 853 860 6 799 805
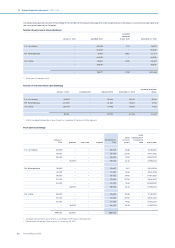
2012 2013
Netherlands other total Netherlands other total
Fair value of plan assets at beginning of year 13,946 7,303 21,249 15,203 7,588 22,791
Interest income on plan assets 531 337 868 496 317 813
Admin expenses paid (4) (5) (9) (9) (5) (14)
Return on plan assets excluding interest income 1,237 460 1,697 (426) (338) (764)
Employee contributions − 4 4 − 4 4
Employer contributions 209 216 425 283 187 470
Divestments − (1) (1) − (1) (1)
Settlements − (294) (294) − (311) (311)
Benefits paid (716) (407) (1,123) (704) (407) (1,111)
Exchange rate dierences − (25) (25) − (306) (306)
Fair value of plan assets at end of year 15,203 7,588 22,791 14,843 6,728 21,571
Funded status 770 (1,433) (663) 549 (1,183) (634)
Unrecognized net assets (777) (586) (1,363) (555) (428) (983)
Net balance sheet position (7) (2,019) (2,026) (6) (1,611) (1,617)