Philips 2013 Annual Report Download - page 162
Download and view the complete annual report
Please find page 162 of the 2013 Philips annual report below. You can navigate through the pages in the report by either clicking on the pages listed below, or by using the keyword search tool below to find specific information within the annual report.-
 1
1 -
2
-
3
-
4
-
5
-
6
-
7
-
8
-
9
-
10
-
11
-
12
-
13
-
14
-
15
-
16
-
17
-
18
-
19
-
20
-
21
-
22
-
23
-
24
-
25
-
26
-
27
-
28
-
29
-
30
-
31
-
32
-
33
-
34
-
35
-
36
-
37
-
38
-
39
-
40
-
41
-
42
-
43
-
44
-
45
-
46
-
47
-
48
-
49
-
50
-
51
-
52
-
53
-
54
-
55
-
56
-
57
-
58
-
59
-
60
-
61
-
62
-
63
-
64
-
65
-
66
-
67
-
68
-
69
-
70
-
71
-
72
-
73
-
74
-
75
-
76
-
77
-
78
-
79
-
80
-
81
-
82
-
83
-
84
-
85
-
86
-
87
-
88
-
89
-
90
-
91
-
92
-
93
-
94
-
95
-
96
-
97
-
98
-
99
-
100
-
101
-
102
-
103
-
104
-
105
-
106
-
107
-
108
-
109
-
110
-
111
-
112
-
113
-
114
-
115
-
116
-
117
-
118
-
119
-
120
-
121
-
122
-
123
-
124
-
125
-
126
-
127
-
128
-
129
-
130
-
131
-
132
-
133
-
134
-
135
-
136
-
137
-
138
-
139
-
140
-
141
-
142
-
143
-
144
-
145
-
146
-
147
-
148
-
149
-
150
-
151
-
 152
152 -
 153
153 -
 154
154 -
 155
155 -
 156
156 -
 157
157 -
 158
158 -
 159
159 -
 160
160 -
 161
161 -
 162
162 -
 163
163 -
 164
164 -
 165
165 -
 166
166 -
 167
167 -
 168
168 -
 169
169 -
 170
170 -
 171
171 -
 172
172 -
173
-
174
-
175
-
176
-
177
-
178
-
179
-
180
-
181
-
182
-
183
-
184
-
185
-
186
-
187
-
188
-
189
-
190
-
191
-
192
-
193
-
194
-
195
-
196
-
197
-
198
-
199
-
200
-
201
-
202
-
203
-
204
-
205
-
206
-
207
-
208
-
209
-
210
-
211
-
212
-
213
-
214
-
215
-
216
-
217
-
218
-
219
-
220
-
221
-
222
-
223
-
224
-
225
-
226
-
227
-
228
-
229
-
230
-
231
-
232
-
233
-
234
-
235
-
236
-
237
-
238
-
239
-
240
-
241
-
242
-
243
-
244
-
245
-
246
-
247
-
248
-
249
-
250
 |
 |

14 15 16 17 18 11 Group financial statements 11.9 - 11.9
162 Annual Report 2013
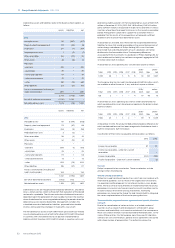
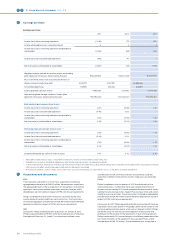
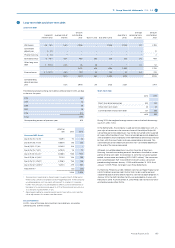
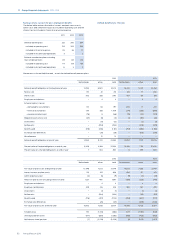
14 Other non-current financial assets
The changes during 2013 were as follows:
availa-
ble-for-
sale
financial
assets
loans
and re-
ceivables
held-to-
maturity
invest-
ments
financial
assets at
fair value
through
profit or
loss total
Balance as of
January 1, 2013 232 267 3 47 549
Changes:
Reclassifications 6 37 − − 43
Acquisitions/
additions 17 13 1 − 31
Sales/
redemptions/
reductions (11) (6) − (8) (25)
Impairment (8) (2) − − (10)
Transfer to assets
classified as held
for sale (62) (30) − − (92)
Value
adjustments 17 1 − (9) 9
Translation and
exchange
dierences 1 (8) (1) (1) (9)
Balance as of
December 31,
2013 192 272 3 29 496
Available-for-sale financial assets
The Company’s investments in available-for-sale financial assets mainly
consist of investments in common stock of companies in various
industries. An amount of EUR 62 million has been reclassified as assets
held for sale in relation to the agreed contribution to the Dutch Pension
Fund (please refer to note 30, Post-employment benefits and note 36,
Subsequent events).
Loans and receivables
During 2013 loans with face value EUR 30 million were transferred to
assets held for sale in relation to the agreed contribution to the Dutch
Pension Fund (please refer to note 30, Post-employment benefits and
note 36, Subsequent events).
Financial assets at fair value through profit or loss
The reduction of financial assets at fair value through profit and loss
includes certain financial instruments that Philips received in exchange for
the transfer of its television activities. The initial value of EUR 17 million was
adjusted by EUR 11 million during 2012 and EUR 6 million in 2013 reported
under Value adjustments. As of December 31, 2013 the fair value reported
was nil. On January 20, 2014, Philips has signed a term sheet to transfer its
remaining 30% stake in TP Vision, which will also impact the above
commitments. For further information, please refer to note 36,
Subsequent events.
In 2010 Philips sold its entire holding of common shares in NXP
Semiconductors B.V. (NXP) to Philips Pension Trustees Limited (herein
referred to as “UK Pension Fund”). As a result of this transaction the UK
Pension Fund obtained the full legal title and ownership of the NXP
shares, including the entitlement to any future dividends and the proceeds
from any sale of shares. From the date of the transaction, the NXP shares
became an integral part of the plan assets of the UK Pension Fund. The
purchase agreement with the UK Pension Fund includes an arrangement
that may entitle Philips to a cash payment from the UK Pension Fund on or
after September 7, 2014, if the total value yielded by the NXP shares has
increased by this date to a level in excess of a predetermined threshold,
which at the time of the transaction was substantially above the
transaction price, and the UK Pension Fund is in a surplus (on a swaps
basis) on September 7, 2014. The arrangement qualifies as a financial
instrument and is reported under Other non-current financial assets. The
Trustees of the UK Pension Fund have been selling the NXP shares in a
number of transactions since 2010. The remaining number of NXP shares
were sold in the course of 2013 and the total sale proceeds of the NXP
shares exceeded the predetermined threshold. However as of December
31, 2013 the UK Pension Fund was not in surplus (on the agreed swaps
basis). The fair value of the arrangement was estimated to be EUR 14
million as of December 31, 2012. As of December 31, 2013 management’s
best estimate of the fair value of the arrangement is EUR 7 million, based
on the current funded status as of December 31, 2013 (swaps basis) and
the economic and demographic risks of the UK Pension Fund. The change
in fair value in 2013 is reported under Value adjustments in the table above
and also recognized in Financial income and expense.
15 Other non-current assets
Other non-current assets in 2013 are comprised of prepaid pension costs
of EUR 5 million (2012: EUR 7 million) and prepaid expenses of EUR 58
million (2012: EUR 87 million).
For further details see note 30, Post-employment benefits.
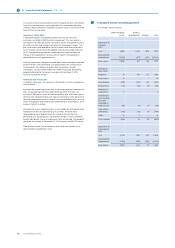
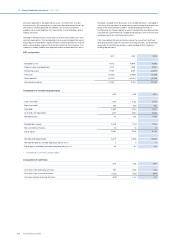
16 Inventories
Inventories are summarized as follows:
2012 2013
Raw materials and supplies 1,039 1,029
Work in process 513 375
Finished goods 1,943 1,836
3,495 3,240
During 2013, inventories associated with the Audio, Video, Multimedia and
Accessories (AVM&A) business have been reclassified to Assets held for
sale. For more details, please refer note 7, Discontinued operations and
other assets classified as held for sale.
The write-down of inventories to net realizable value amounted in 2013 to
EUR 199 million (2012: EUR 273 million). The write-down is included in cost
of sales.
17 Other current assets
Other current assets include prepaid expenses of EUR 354 million (2012:
EUR 337 million).
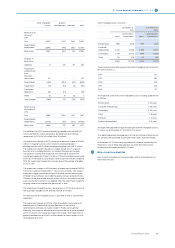
18 Current receivables
The accounts receivable, net, per sector are as follows:
2012 2013
Healthcare 1,967 1,978
Consumer Lifestyle 865 743
Lighting 1,364 1,567
Innovation, Group & Services 138 132
4,334 4,420
The aging analysis of accounts receivable, net, is set out below:
2012 2013
current 3,624 3,671
overdue 1-30 days 272 287
overdue 31-180 days 298 305
overdue > 180 days 140 157
4,334 4,420
A large part of overdue trade accounts receivable relates to public sector
customers with slow payment approval processes. The allowance for
doubtful accounts receivable has been primarily established for
receivables that are past due.