Philips 2013 Annual Report Download - page 230
Download and view the complete annual report
Please find page 230 of the 2013 Philips annual report below. You can navigate through the pages in the report by either clicking on the pages listed below, or by using the keyword search tool below to find specific information within the annual report.-
 1
1 -
2
-
3
-
4
-
5
-
6
-
7
-
8
-
9
-
10
-
11
-
12
-
13
-
14
-
15
-
16
-
17
-
18
-
19
-
20
-
21
-
22
-
23
-
24
-
25
-
26
-
27
-
28
-
29
-
30
-
31
-
32
-
33
-
34
-
35
-
36
-
37
-
38
-
39
-
40
-
41
-
42
-
43
-
44
-
45
-
46
-
47
-
48
-
49
-
50
-
51
-
52
-
53
-
54
-
55
-
56
-
57
-
58
-
59
-
60
-
61
-
62
-
63
-
64
-
65
-
66
-
67
-
68
-
69
-
70
-
71
-
72
-
73
-
74
-
75
-
76
-
77
-
78
-
79
-
80
-
81
-
82
-
83
-
84
-
85
-
86
-
87
-
88
-
89
-
90
-
91
-
92
-
93
-
94
-
95
-
96
-
97
-
98
-
99
-
100
-
101
-
102
-
103
-
104
-
105
-
106
-
107
-
108
-
109
-
110
-
111
-
112
-
113
-
114
-
115
-
116
-
117
-
118
-
119
-
120
-
121
-
122
-
123
-
124
-
125
-
126
-
127
-
128
-
129
-
130
-
131
-
132
-
133
-
134
-
135
-
136
-
137
-
138
-
139
-
140
-
141
-
142
-
143
-
144
-
145
-
146
-
147
-
148
-
149
-
150
-
151
-
152
-
153
-
154
-
155
-
156
-
157
-
158
-
159
-
160
-
161
-
162
-
163
-
164
-
165
-
166
-
167
-
168
-
169
-
170
-
171
-
172
-
173
-
174
-
175
-
176
-
177
-
178
-
179
-
180
-
181
-
182
-
183
-
184
-
185
-
186
-
187
-
188
-
189
-
190
-
191
-
192
-
193
-
194
-
195
-
196
-
197
-
198
-
199
-
200
-
201
-
202
-
203
-
204
-
205
-
206
-
207
-
208
-
209
-
210
-
211
-
212
-
213
-
214
-
215
-
216
-
217
-
218
-
219
-
 220
220 -
 221
221 -
 222
222 -
 223
223 -
 224
224 -
 225
225 -
 226
226 -
 227
227 -
 228
228 -
 229
229 -
 230
230 -
 231
231 -
 232
232 -
 233
233 -
 234
234 -
 235
235 -
 236
236 -
 237
237 -
 238
238 -
 239
239 -
 240
240 -
241
-
242
-
243
-
244
-
245
-
246
-
247
-
248
-
249
-
250
 |
 |

15 Five-year overview 15 - 15
230 Annual Report 2013
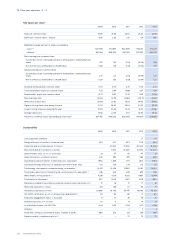
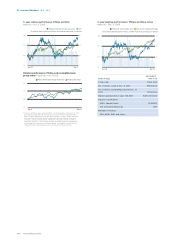
15 Five-year overview
all amounts in millions of euros unless otherwise stated
Prior-period financial statements have been restated for the treatment of Audio, Video, Multimedia and Accessories as
discontinued operations (see note 7, Discontinued operations and other assets classified as held for sale) and the adoption
of IAS 19R, which mainly relates to pension reporting (see note 30, Post-employment benefits).
Due to factors such as acquisitions and divestments, the amounts, percentages and ratios are not directly comparable.
General data
2009 2010 2011 2012 2013
Sales 18,149 20,415 20,992 23,457 23,329
% increase over previous year (6) 12 3 12 (1)
Income from operations (EBIT) (loss) 377 1,721 (479) 648 1,991
Financial income and expenses - net (280) (175) (331) (329) (330)
Income (loss) from continuing operations 173 1,157 (1,046) (77) 1,170
Income (loss) from continuing operations attributable to shareholders 159 1,151 (1,050) (82) 1,167
Income (loss) from discontinued operations 86 144 (410) 47 2
Net income (loss) 259 1,301 (1,456) (30) 1,172
Net income (loss) attributable to shareholders 245 1,295 (1,460) (35) 1,169
Free cash flow 411 1,235 (97) 1,627 172
Net assets 14,631 15,067 12,362 11,185 11,227
Turnover rate of net operating capital1) 1.39 1.50 1.75 2.12 2.27
Total employees at year-end 116,153 119,775 125,240 118,087 116,681
1) Calculated based on balance sheet positions related to continued operations
2) In euros unless otherwise stated
3) In thousands of shares
4) Adjusted to make previous years comparable for the bonus shares (273 thousand) issued in May 2013
5) In manufacturing excluding new acquisitions
Income
2009 2010 2011 2012 2013
EBIT 377 1,721 (479) 648 1,991
as a % of sales 2.1 8.4 (2.3) 2.8 8.5
EBITA 807 2,188 1,435 1,106 2,451
as a % of sales 4.4 10.7 6.8 4.7 10.5
Income taxes 0.0 (407) (251) (185) (466)
as a % of income before taxes 0.0 (26.3) 31.0 (58.0) (28.1)
Income (loss) from continuing operations 173 1,157 (1,046) (77) 1,170
as a % of shareholders’ equity (ROE) 1.2 7.6 (7.8) (0.6) 10.6
Net income (loss) 259 1,301 (1,456) (30) 1,172