Philips 2013 Annual Report Download - page 165
Download and view the complete annual report
Please find page 165 of the 2013 Philips annual report below. You can navigate through the pages in the report by either clicking on the pages listed below, or by using the keyword search tool below to find specific information within the annual report.-
 1
1 -
2
-
3
-
4
-
5
-
6
-
7
-
8
-
9
-
10
-
11
-
12
-
13
-
14
-
15
-
16
-
17
-
18
-
19
-
20
-
21
-
22
-
23
-
24
-
25
-
26
-
27
-
28
-
29
-
30
-
31
-
32
-
33
-
34
-
35
-
36
-
37
-
38
-
39
-
40
-
41
-
42
-
43
-
44
-
45
-
46
-
47
-
48
-
49
-
50
-
51
-
52
-
53
-
54
-
55
-
56
-
57
-
58
-
59
-
60
-
61
-
62
-
63
-
64
-
65
-
66
-
67
-
68
-
69
-
70
-
71
-
72
-
73
-
74
-
75
-
76
-
77
-
78
-
79
-
80
-
81
-
82
-
83
-
84
-
85
-
86
-
87
-
88
-
89
-
90
-
91
-
92
-
93
-
94
-
95
-
96
-
97
-
98
-
99
-
100
-
101
-
102
-
103
-
104
-
105
-
106
-
107
-
108
-
109
-
110
-
111
-
112
-
113
-
114
-
115
-
116
-
117
-
118
-
119
-
120
-
121
-
122
-
123
-
124
-
125
-
126
-
127
-
128
-
129
-
130
-
131
-
132
-
133
-
134
-
135
-
136
-
137
-
138
-
139
-
140
-
141
-
142
-
143
-
144
-
145
-
146
-
147
-
148
-
149
-
150
-
151
-
152
-
153
-
154
-
 155
155 -
 156
156 -
 157
157 -
 158
158 -
 159
159 -
 160
160 -
 161
161 -
 162
162 -
 163
163 -
 164
164 -
 165
165 -
 166
166 -
 167
167 -
 168
168 -
 169
169 -
 170
170 -
 171
171 -
 172
172 -
 173
173 -
 174
174 -
 175
175 -
176
-
177
-
178
-
179
-
180
-
181
-
182
-
183
-
184
-
185
-
186
-
187
-
188
-
189
-
190
-
191
-
192
-
193
-
194
-
195
-
196
-
197
-
198
-
199
-
200
-
201
-
202
-
203
-
204
-
205
-
206
-
207
-
208
-
209
-
210
-
211
-
212
-
213
-
214
-
215
-
216
-
217
-
218
-
219
-
220
-
221
-
222
-
223
-
224
-
225
-
226
-
227
-
228
-
229
-
230
-
231
-
232
-
233
-
234
-
235
-
236
-
237
-
238
-
239
-
240
-
241
-
242
-
243
-
244
-
245
-
246
-
247
-
248
-
249
-
250
 |
 |

11 Group financial statements 11.9 - 11.9 20
Annual Report 2013 165
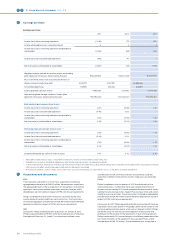
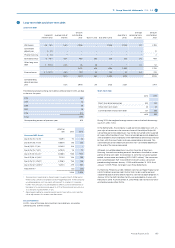
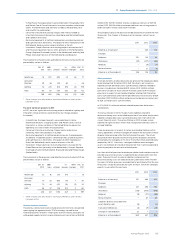
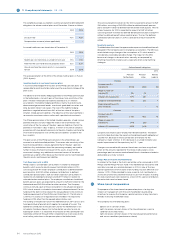
20 Long-term debt and short-term debt
Long-term debt
(range of)
interest rates
average rate of
interest
amount
outstanding
2013 due in 1 year due after 1 year
due after 5
years
average
remaining term
(in years)
amount
outstanding
2012
USD bonds 3.8 - 7.8% 5.6% 2,958 − 2,958 2,059 13.7 3,198
Convertible
debentures 0 - 0% − − − − − − 12
Private financing 0 - 0% − − − − − − 2
Bank borrowings 0 - 7.8% 2.0% 466 260 206 203 3.6 469
Other long-term
debt 0 - 19.0% 4.4% 48 48 − − 1.0 52
3,472 308 3,164 2,262 3,733
Finance leases 0.7 - 15.1% 3.8% 199 54 145 53 6.3 243
5.0% 3,671 362 3,309 2,315 3,976
Corresponding
data of previous
year 5.2% 3,976 251 3,725 3,357 3,417
The following amounts of long-term debt as of December 31, 2013, are due
in the next five years:
2014 362
2015 42
2016 26
2017 16
2018 910
Total 1,356
Corresponding amount of previous year 619
eective
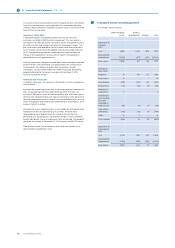
rate 2012 2013
Unsecured USD Bonds
Due 5/15/25; 7 3/4% 7.429% 75 72
Due 6/01/26; 7 1/5% 6.885% 126 120
Due 8/15/13; 7 1/4% 6.382% 108 −
Due 5/15/25; 7 1/8% 6.794% 78 74
Due 3/11/18; 5 3/4%1) 6.066% 948 907
Due 3/11/38; 6 7/8%1) 7.210% 758 726
Due 3/15/22; 3.750%1) 3.906% 758 726
Due 3/15/42; 5.000%1) 5.273% 379 363
Adjustments2) (32) (30)
3,198 2,958
1) The provisions applicable to these bonds, issued in March 2008 and in
March 2012, contain a ‘Change of Control Triggering Event’. If the Company
would experience such an event with respect to a series of corporate
bonds, the Company may be required to oer to purchase the bonds of
the series at a purchase price equal to 101% of the principal amount, plus
accrued and unpaid interest, if any.
2) Adjustments relate to issued bond discounts, transaction costs and fair
value adjustments for interest rate derivatives
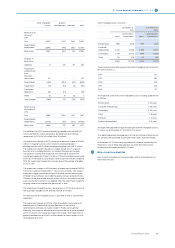
Secured liabilities
In 2013, none of the long-term and short-term debt was secured by
collateral (2012: EUR nil million).
Short-term debt
2012 2013
Short-term bank borrowings 533 207
Other short-term loans 25 23
Current portion of long-term debt 251 362
809 592
During 2013, the weighted average interest rate on the bank borrowings
was 6.4% (2012: 7.8%).
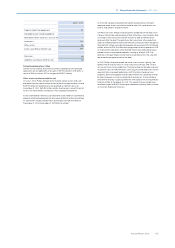
In the Netherlands, the Company issued personnel debentures with a 5-
year right of conversion into common shares of Koninklijke Philips NV.
Convertible personnel debentures may not be converted within a period
of 3 years after the date of issue. These convertible personnel debentures
were available to most employees in the Netherlands and were purchased
by them with their own funds and were redeemable on demand. The
convertible personnel debentures become non-convertible debentures
at the end of the conversion period.
Although convertible debentures have the character of long-term
financing, the total outstanding amounts have been classified as current
portion of long-term debt. At December 31, 2013 the conversion period
ended, so none were outstanding (2012: EUR 12 million). The conversion
price varied between EUR 14.2 and EUR 24.6 with various conversion
periods ending between January 1, 2013 and December 31, 2013. As of
January 1, 2009, Philips no longer issues these debentures.
Furthermore, Philips has a USD 2.5 billion Commercial Paper Program and
a EUR 1.8 billion revolving credit facility that can be used for general
corporate purposes and as a backstop of its commercial paper program. In
January 2013, the EUR 1.8 billion facility was extended by 2 years until
February 18, 2018. As of December 31, 2013 Philips did not have any loans
outstanding under either facility.