Philips 2013 Annual Report Download - page 185
Download and view the complete annual report
Please find page 185 of the 2013 Philips annual report below. You can navigate through the pages in the report by either clicking on the pages listed below, or by using the keyword search tool below to find specific information within the annual report.-
 1
1 -
2
-
3
-
4
-
5
-
6
-
7
-
8
-
9
-
10
-
11
-
12
-
13
-
14
-
15
-
16
-
17
-
18
-
19
-
20
-
21
-
22
-
23
-
24
-
25
-
26
-
27
-
28
-
29
-
30
-
31
-
32
-
33
-
34
-
35
-
36
-
37
-
38
-
39
-
40
-
41
-
42
-
43
-
44
-
45
-
46
-
47
-
48
-
49
-
50
-
51
-
52
-
53
-
54
-
55
-
56
-
57
-
58
-
59
-
60
-
61
-
62
-
63
-
64
-
65
-
66
-
67
-
68
-
69
-
70
-
71
-
72
-
73
-
74
-
75
-
76
-
77
-
78
-
79
-
80
-
81
-
82
-
83
-
84
-
85
-
86
-
87
-
88
-
89
-
90
-
91
-
92
-
93
-
94
-
95
-
96
-
97
-
98
-
99
-
100
-
101
-
102
-
103
-
104
-
105
-
106
-
107
-
108
-
109
-
110
-
111
-
112
-
113
-
114
-
115
-
116
-
117
-
118
-
119
-
120
-
121
-
122
-
123
-
124
-
125
-
126
-
127
-
128
-
129
-
130
-
131
-
132
-
133
-
134
-
135
-
136
-
137
-
138
-
139
-
140
-
141
-
142
-
143
-
144
-
145
-
146
-
147
-
148
-
149
-
150
-
151
-
152
-
153
-
154
-
155
-
156
-
157
-
158
-
159
-
160
-
161
-
162
-
163
-
164
-
165
-
166
-
167
-
168
-
169
-
170
-
171
-
172
-
173
-
174
-
 175
175 -
 176
176 -
 177
177 -
 178
178 -
 179
179 -
 180
180 -
 181
181 -
 182
182 -
 183
183 -
 184
184 -
 185
185 -
 186
186 -
 187
187 -
 188
188 -
 189
189 -
 190
190 -
 191
191 -
 192
192 -
 193
193 -
 194
194 -
 195
195 -
196
-
197
-
198
-
199
-
200
-
201
-
202
-
203
-
204
-
205
-
206
-
207
-
208
-
209
-
210
-
211
-
212
-
213
-
214
-
215
-
216
-
217
-
218
-
219
-
220
-
221
-
222
-
223
-
224
-
225
-
226
-
227
-
228
-
229
-
230
-
231
-
232
-
233
-
234
-
235
-
236
-
237
-
238
-
239
-
240
-
241
-
242
-
243
-
244
-
245
-
246
-
247
-
248
-
249
-
250
 |
 |

11 Group financial statements 11.9 - 11.9
Annual Report 2013 185
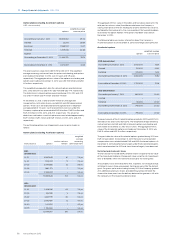
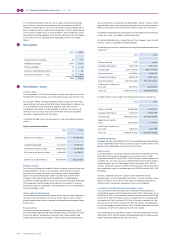
Furthermore, Philips has a USD 2.5 billion Commercial Paper Program and
a EUR 1.8 billion revolving credit facility that can be used for general group
purpose and as a backstop for its commercial paper program. In January
2013 the EUR 1.8 billion facility was extended by 2 years until February 18,
2018. The facility has no financial covenants and repetitive material
adverse change clauses and can be used for general group purposes. As of
December 31, 2013, Philips did not have any amounts outstanding under
any of these facilities. Additionally Philips also held EUR 65 million of
equity investments in available-for-sale financial assets (fair value at
December 31, 2013).
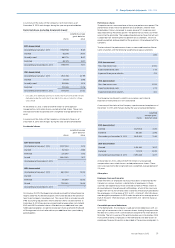
Currency risk
Currency risk is the risk that the fair value or future cash flows of a financial
instrument will fluctuate because of changes in foreign exchange rates.
Currency fluctuations may impact Philips’ financial results. Philips is
exposed to currency risk in the following areas:
• Transaction exposures, related to forecasted sales and purchases and
on-balance-sheet receivables/payables resulting from such
transactions
• Translation exposure of net income in foreign entities
• Translation exposure of foreign-currency intercompany and external
debt and deposits
• Translation exposure of foreign-currency-denominated equity
invested in consolidated companies
• Translation exposure to equity interests in non-functional-currency
investments in associates and available-for-sale financial assets.
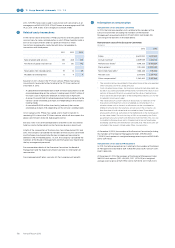
It is Philips’ policy that significant transaction exposures are hedged by the
businesses. Accordingly, all businesses are required to identify and
measure their exposures resulting from material transactions
denominated in currencies other than their own functional currency.
Philips’ policy generally requires committed foreign currency exposures to
be fully hedged using forwards. Anticipated transactions may be hedged
using forwards or options or a combination thereof. The amount hedged
as a proportion of the total anticipated exposure identified varies per
business and is a function of the ability to project cash flows, the time
horizon for the cash flows and the way in which the businesses can adapt
to changing levels of foreign-currency exchange rates. As a result, hedging
activities cannot and will not eliminate all currency risks for these
anticipated transaction exposures. Generally, the maximum tenor of these
hedges is 18 months.
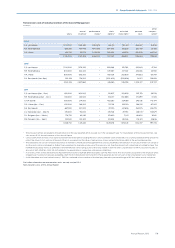
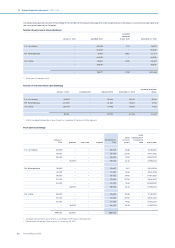
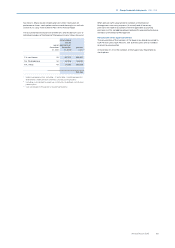
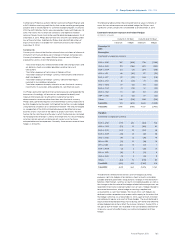
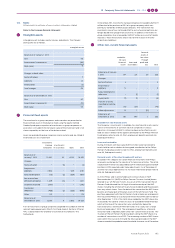
The following table outlines the estimated nominal value in millions of
euros for transaction exposure and related hedges for Philips’ most
significant currency exposures consolidated as of December 31, 2013:
Estimated transaction exposure and related hedges
in millions of euros
maturity 0-60 days maturity over 60 days
exposure hedges exposure hedges
December 31,
2013
Receivables
Functional vs. exposure currency
EUR vs. USD 387 (364) 1,718 (1,169)
USD vs. EUR 191 (166) 695 (354)
EUR vs. GBP 83 (71) 284 (158)
USD vs. JPY 46 (42) 217 (113)
EUR vs. JPY 39 (39) 166 (116)
EUR vs. CNY 18 (18) 73 (41)
USD vs. AUD 16 (12) 65 (33)
EUR vs. CHF 21 (18) 57 (33)
USD vs. CAD 10 (8) 63 (33)
GBP vs. USD 12 (12) 57 (33)
Others 148 (124) 296 (156)
Total 2013 971 (874) 3,691 (2,239)
Total 2012 1,098 (998) 4,037 (2,453)
Payables
Functional vs. exposure currency
EUR vs. USD (171) 253 (831) 518
USD vs. CNY (70) 70 (162) 92
EUR vs. PLN (30) 24 (102) 36
EUR vs. GBP (23) 18 (81) 46
USD vs. SGD (14) 12 (26) 19
INR vs. USD (21) 21 (16) 16
IDR vs. USD (24) 14 (12) 7
EUR vs. RON (3) 3 (28) 15
BRL vs. USD (14) 11 (15) 8
USD vs. EUR (5) 4 (18) 9
Others (82) 72 (106) 65
Total 2013 (457) 502 (1,397) 831
Total 2012 (622) 560 (1,875) 1,050
The derivatives related to transactions are, for hedge accounting
purposes, split into hedges of on-balance-sheet accounts receivable/
payable and forecasted sales and purchases. Changes in the value of on-
balance-sheet foreign-currency accounts receivable/payable, as well as
the changes in the fair value of the hedges related to these exposures, are
reported in the income statement under costs of sales. Hedges related to
forecasted transactions, where hedge accounting is applied, are
accounted for as cash flow hedges. The results from such hedges are
deferred in other comprehensive income within equity to the extent that
the hedge is eective. As of December 31, 2013, a gain of EUR 24 million
was deferred in equity as a result of these hedges. The result deferred in
equity will be released to earnings mostly during 2014 at the time when the
related hedged transactions aect the income statement. During 2013, a
net gain of EUR 5 million was recorded in the consolidated statement of
income as a result of ineectiveness on certain anticipated cash flow
hedges.