Philips 2013 Annual Report Download - page 149
Download and view the complete annual report
Please find page 149 of the 2013 Philips annual report below. You can navigate through the pages in the report by either clicking on the pages listed below, or by using the keyword search tool below to find specific information within the annual report.-
 1
1 -
2
-
3
-
4
-
5
-
6
-
7
-
8
-
9
-
10
-
11
-
12
-
13
-
14
-
15
-
16
-
17
-
18
-
19
-
20
-
21
-
22
-
23
-
24
-
25
-
26
-
27
-
28
-
29
-
30
-
31
-
32
-
33
-
34
-
35
-
36
-
37
-
38
-
39
-
40
-
41
-
42
-
43
-
44
-
45
-
46
-
47
-
48
-
49
-
50
-
51
-
52
-
53
-
54
-
55
-
56
-
57
-
58
-
59
-
60
-
61
-
62
-
63
-
64
-
65
-
66
-
67
-
68
-
69
-
70
-
71
-
72
-
73
-
74
-
75
-
76
-
77
-
78
-
79
-
80
-
81
-
82
-
83
-
84
-
85
-
86
-
87
-
88
-
89
-
90
-
91
-
92
-
93
-
94
-
95
-
96
-
97
-
98
-
99
-
100
-
101
-
102
-
103
-
104
-
105
-
106
-
107
-
108
-
109
-
110
-
111
-
112
-
113
-
114
-
115
-
116
-
117
-
118
-
119
-
120
-
121
-
122
-
123
-
124
-
125
-
126
-
127
-
128
-
129
-
130
-
131
-
132
-
133
-
134
-
135
-
136
-
137
-
138
-
 139
139 -
 140
140 -
 141
141 -
 142
142 -
 143
143 -
 144
144 -
 145
145 -
 146
146 -
 147
147 -
 148
148 -
 149
149 -
 150
150 -
 151
151 -
 152
152 -
 153
153 -
 154
154 -
 155
155 -
 156
156 -
 157
157 -
 158
158 -
 159
159 -
160
-
161
-
162
-
163
-
164
-
165
-
166
-
167
-
168
-
169
-
170
-
171
-
172
-
173
-
174
-
175
-
176
-
177
-
178
-
179
-
180
-
181
-
182
-
183
-
184
-
185
-
186
-
187
-
188
-
189
-
190
-
191
-
192
-
193
-
194
-
195
-
196
-
197
-
198
-
199
-
200
-
201
-
202
-
203
-
204
-
205
-
206
-
207
-
208
-
209
-
210
-
211
-
212
-
213
-
214
-
215
-
216
-
217
-
218
-
219
-
220
-
221
-
222
-
223
-
224
-
225
-
226
-
227
-
228
-
229
-
230
-
231
-
232
-
233
-
234
-
235
-
236
-
237
-
238
-
239
-
240
-
241
-
242
-
243
-
244
-
245
-
246
-
247
-
248
-
249
-
250
 |
 |

11 Group financial statements 11.9 - 11.9 4
Annual Report 2013 149
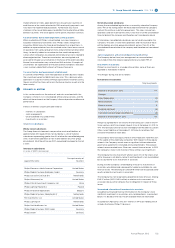
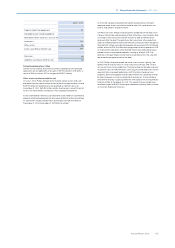
Audit fees
Fees KPMG
2011 2012 2013
Audit fees 15.6 14.7 15.6
- consolidated financial statements 10.1 9.7 10.1
- statutory financial statements 5.5 5.0 5.5
Audit-related fees 1) 2.4 5.6 2.2
- acquisitions and divestments 0.1 2.9 0.4
- sustainability assurance 0.5 0.8 0.7
- other 1.8 1.9 1.1
Tax fees 2) 0.9 1.3 0.8
-tax compliance services 0.9 1.3 0.8
Other fees 3) 0.5 0.7 1.3
- royalty investigation 0.4 0.1 0.0
- other 0.1 0.6 1.3
Total 19.4 22.3 19.9
1) The percentage of services provided in 2013 is 11.1% of the total fees
2) The percentage of services provided in 2013 is 4.0% of the total fees
3) The percentage of services provided in 2013 is 6.5% of the total fees
This table ’Fees KPMG’ forms an integral part of the Company Financial
Statements, please refer to note K, Audit fees.
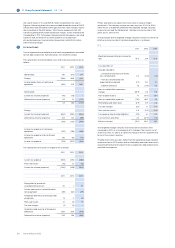
Impairment of goodwill
In 2013, goodwill impairment charges amounts to EUR 28 million, including
EUR 26 million as result of reduced growth expectations in Consumer
Luminaires.
In 2011, goodwill was impaired in the Healthcare sector for an amount of
EUR 824 million and in the Lighting sector for an amount of EUR 531
million.
For further information on impairment of goodwill, see note 11, Goodwill.
Other business income (expenses)
Other business income (expenses) consists of the following:
2011 2012 2013
Result on disposal of businesses:
- income 27 9 50
- expense (26) (84) (1)
Result on disposal of fixed assets:
- income 47 224 19
- expense (11) (9) (13)
Result on other remaining businesses:
- income 50 42 54
- expense (39) (515) (21)
48 (333) 88
Total other business income 124 275 123
Total other business expense (76) (608) (35)
In 2013, result on disposal of businesses was mainly due to divestment of
non-strategic businesses within Healthcare. For further information, see
note 9, Acquisitions and divestments
In 2013, result on disposal of fixed assets was mainly due to sale of real
estate assets.
In 2013, result on other remaining businesses were mainly due to release
of earn out provisions. For further information, see note 21, Provisions.
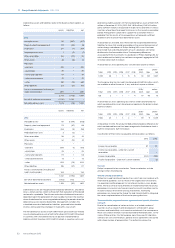
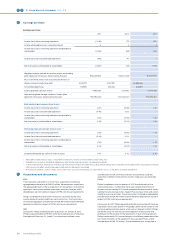
4Financial income and expenses
2011 2012 2013
Interest income 39 37 55
Interest income from loans and
receivables 5 20 33
Interest income from cash and cash
equivalents 34 17 22
Dividend income from available for sale
financial assets 11 4 5
Net gains from disposal of financial
assets 51 1 −
Net change in fair value of financial
assets at fair value through profit or loss 6 − −
Net change in fair value of financial
liabilities at fair value through profit or
loss − 44 −
Net foreign exchange gains − − −
Other financial income 6 20 10
Financial income 113 106 70
Interest expense (340) (363) (323)
Interest on debt and borrowings (245) (271) (245)
Finance charges under finance lease
contract (3) (7) (7)
Interest expenses - pensions (92) (85) (71)
Unwind of discount of provisions (33) (22) (25)
Net foreign exchange losses (2) − (6)
Impairment loss of financial assets (34) (8) (10)
Net change in fair value of financial
assets at fair value through profit or loss (2) (9)
Net change in fair value of financial
liabilities at fair value through profit or
loss (3)
Other financial expenses (35) (40) (24)
Financial expense (444) (435) (400)
Financial income and expenses (331) (329) (330)
Net financial income and expense showed a EUR 330 million expenses in
2013, which was 1 million higher than in 2012. Total finance income of EUR
70 million included EUR 55 million interest income. Remaining financial
income included dividend income of EUR 5 million and other finance
income of EUR 10 million. Total financial expense of EUR 400 million
included EUR 10 million impairment charges and EUR 323 million interest
expenses. Remaining financial expense consisted mainly of EUR 25
million of accretion expenses associated with discounted provisions and
uncertain tax positions and EUR 24 million other financing charges.
Net financial income and expense showed a EUR 329 million expense in
2012, which was EUR 2 million lower than in 2011. Total financial income of
EUR 106 million included a EUR 46 million gain related to a change in
estimate on the valuation of long term derivative contracts. Remaining
financial expense consisted mainly of EUR 22 million of accretion
expenses associated with discounted provisions and uncertain tax
positions and EUR 40 million other financing charges.
Net financial income and expense showed a EUR 331 million expense in
2011. Total finance income of EUR 113 million included EUR 51 million gain
on the disposal of financial assets, of which EUR 44 million resulted from