Philips 2013 Annual Report Download - page 65
Download and view the complete annual report
Please find page 65 of the 2013 Philips annual report below. You can navigate through the pages in the report by either clicking on the pages listed below, or by using the keyword search tool below to find specific information within the annual report.-
 1
1 -
2
-
3
-
4
-
5
-
6
-
7
-
8
-
9
-
10
-
11
-
12
-
13
-
14
-
15
-
16
-
17
-
18
-
19
-
20
-
21
-
22
-
23
-
24
-
25
-
26
-
27
-
28
-
29
-
30
-
31
-
32
-
33
-
34
-
35
-
36
-
37
-
38
-
39
-
40
-
41
-
42
-
43
-
44
-
45
-
46
-
47
-
48
-
49
-
50
-
51
-
52
-
53
-
54
-
 55
55 -
 56
56 -
 57
57 -
 58
58 -
 59
59 -
 60
60 -
 61
61 -
 62
62 -
 63
63 -
 64
64 -
 65
65 -
 66
66 -
 67
67 -
 68
68 -
 69
69 -
 70
70 -
 71
71 -
 72
72 -
 73
73 -
 74
74 -
 75
75 -
76
-
77
-
78
-
79
-
80
-
81
-
82
-
83
-
84
-
85
-
86
-
87
-
88
-
89
-
90
-
91
-
92
-
93
-
94
-
95
-
96
-
97
-
98
-
99
-
100
-
101
-
102
-
103
-
104
-
105
-
106
-
107
-
108
-
109
-
110
-
111
-
112
-
113
-
114
-
115
-
116
-
117
-
118
-
119
-
120
-
121
-
122
-
123
-
124
-
125
-
126
-
127
-
128
-
129
-
130
-
131
-
132
-
133
-
134
-
135
-
136
-
137
-
138
-
139
-
140
-
141
-
142
-
143
-
144
-
145
-
146
-
147
-
148
-
149
-
150
-
151
-
152
-
153
-
154
-
155
-
156
-
157
-
158
-
159
-
160
-
161
-
162
-
163
-
164
-
165
-
166
-
167
-
168
-
169
-
170
-
171
-
172
-
173
-
174
-
175
-
176
-
177
-
178
-
179
-
180
-
181
-
182
-
183
-
184
-
185
-
186
-
187
-
188
-
189
-
190
-
191
-
192
-
193
-
194
-
195
-
196
-
197
-
198
-
199
-
200
-
201
-
202
-
203
-
204
-
205
-
206
-
207
-
208
-
209
-
210
-
211
-
212
-
213
-
214
-
215
-
216
-
217
-
218
-
219
-
220
-
221
-
222
-
223
-
224
-
225
-
226
-
227
-
228
-
229
-
230
-
231
-
232
-
233
-
234
-
235
-
236
-
237
-
238
-
239
-
240
-
241
-
242
-
243
-
244
-
245
-
246
-
247
-
248
-
249
-
250
 |
 |

4 Group performance 4.3.2 - 4.3.3
Annual Report 2013 65
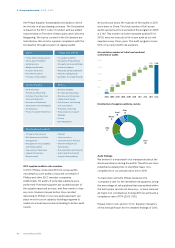
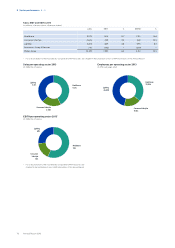
Green Product sales per sector
in millions of euros
■-Healthcare_■-Consumer Lifestyle_■-Lighting
--as a % of sales
14,000
7,000
0
2009
1,791
711
3,393
5,895
32.5
2010
2,136
1,067
4,376
7,579
37.1
2011
2,663
1,101
4,571
8,335
39.7
2012
3,610
1,619
5,752
10,981
46.8
2013
3,690
2,270
5,855
11,815
50.6
New Green Products from each sector include the
following examples.
Healthcare
During 2013, Healthcare expanded the Green Product
portfolio with 13 new products to improve patient
outcomes, provide better value, and expand access to
care, while reducing environmental impact. Philips’ new
EPIQ platform for example, delivers high-quality
ultrasound imaging to every setting where
echocardiography is used and at the same time reduces
both energy use and product weight by almost 30%
compared to the predecessor model. The energy
consumption for each of Philips MRI models is lower
than the market average according to COCIR. Other
examples are new X-ray systems such as DuraDiagnost
systems and a new Certeray X-ray generator, with
significantly lower energy use and product weight
versus predecessor models. Green Products from
Patient Care & Clinical Informatics include MX400/450
and MX 500 patient monitors, for which product weight
is significantly reduced (up to 27%) as well as energy
consumption (up to 23%) when compared to their
predecessor models.
Consumer Lifestyle
Consumer Lifestyle is focusing on the avoidance of
substances of concern, the application of recycled
materials and the energy efficiency of the products. In
2013, in China, Consumer Lifestyle introduced energy
efficient living room Air purifiers. The products have an
energy efficient motor, and score the highest grade (A)
on the China energy label for Air purifiers.
Lighting
An example of a new Green Product introduced in 2013
is the Pacific LED Green Parking system covered
parking solution. It ensures safety, whilst oering
outstanding energy savings, low maintenance and long
lifetimes. Through a mix of LED luminaires, wireless
controls and presence detection, it can save up to 80%
in running costs whilst typically delivering back the
return on investment in under 3 years. As the solution is
wireless, it is an easy retrofit solution that will match the
lumen output of traditional fluorescents.
We aim to create products that have significantly less
impact on the environment during their whole lifecycle
through our EcoDesign process. Overall, the most
significant improvements have been realized in our
energy efficiency Green Focal Area, an important
objective of our EcoVision program, although there was
also growing attention for hazardous substances and
recyclability in all sectors in 2013, the latter driven by
our Circular Economy initiatives.
4.3.3 Green Operations
The Green Operations program focuses on the main
contributors to climate change, recycling of waste,
reduction of water consumption and reduction of
emissions of restricted and hazardous substances.
Full details, can be found in chapter 13, Sustainability
statements, of this Annual Report.
Carbon footprint and energy efficiency
After achieving our EcoVision4 carbon emissions
reduction target in 2012 (25% operational CO2 emissions
reduction compared to 2007, the baseline year) we
continued our energy efficiency improvement
programs across dierent disciplines in 2013. Examples
are Work Place Innovation, partnering in the KLM
BioFuel program and Green Logistics. However, in 2013
our Carbon Footprint increased by 2% to 1,654
kilotonnes CO2 as a result of increased carbon
emissions from air transport (to mitigate supply
shortages), the increased use of SF6 (a substance with
high Global Warming Potential impact) and increased
business travel due to our increasing focus on emerging
markets. These were, however, partly oset by
decreasing emissions resulting from reduced office
space (Work Place Innovation), consolidation of
warehouses, the changing industrial footprint, and the
increase in purchased electricity from renewable
sources.
In 2013, CO2 emissions from non-industrial sites
decreased 20%, in large part attributable to our Work
Place Innovation program which enables flex-working
and thus reduces the floor space in our portfolio. But
also our continuing focus on buildings’ energy
efficiency and the increased share of purchased
electricity from renewable sources have helped
achieve this.