Philips 2013 Annual Report Download - page 5
Download and view the complete annual report
Please find page 5 of the 2013 Philips annual report below. You can navigate through the pages in the report by either clicking on the pages listed below, or by using the keyword search tool below to find specific information within the annual report.-
 1
1 -
 2
2 -
 3
3 -
 4
4 -
 5
5 -
 6
6 -
 7
7 -
 8
8 -
 9
9 -
 10
10 -
 11
11 -
 12
12 -
 13
13 -
 14
14 -
 15
15 -
 16
16 -
17
-
18
-
19
-
20
-
21
-
22
-
23
-
24
-
25
-
26
-
27
-
28
-
29
-
30
-
31
-
32
-
33
-
34
-
35
-
36
-
37
-
38
-
39
-
40
-
41
-
42
-
43
-
44
-
45
-
46
-
47
-
48
-
49
-
50
-
51
-
52
-
53
-
54
-
55
-
56
-
57
-
58
-
59
-
60
-
61
-
62
-
63
-
64
-
65
-
66
-
67
-
68
-
69
-
70
-
71
-
72
-
73
-
74
-
75
-
76
-
77
-
78
-
79
-
80
-
81
-
82
-
83
-
84
-
85
-
86
-
87
-
88
-
89
-
90
-
91
-
92
-
93
-
94
-
95
-
96
-
97
-
98
-
99
-
100
-
101
-
102
-
103
-
104
-
105
-
106
-
107
-
108
-
109
-
110
-
111
-
112
-
113
-
114
-
115
-
116
-
117
-
118
-
119
-
120
-
121
-
122
-
123
-
124
-
125
-
126
-
127
-
128
-
129
-
130
-
131
-
132
-
133
-
134
-
135
-
136
-
137
-
138
-
139
-
140
-
141
-
142
-
143
-
144
-
145
-
146
-
147
-
148
-
149
-
150
-
151
-
152
-
153
-
154
-
155
-
156
-
157
-
158
-
159
-
160
-
161
-
162
-
163
-
164
-
165
-
166
-
167
-
168
-
169
-
170
-
171
-
172
-
173
-
174
-
175
-
176
-
177
-
178
-
179
-
180
-
181
-
182
-
183
-
184
-
185
-
186
-
187
-
188
-
189
-
190
-
191
-
192
-
193
-
194
-
195
-
196
-
197
-
198
-
199
-
200
-
201
-
202
-
203
-
204
-
205
-
206
-
207
-
208
-
209
-
210
-
211
-
212
-
213
-
214
-
215
-
216
-
217
-
218
-
219
-
220
-
221
-
222
-
223
-
224
-
225
-
226
-
227
-
228
-
229
-
230
-
231
-
232
-
233
-
234
-
235
-
236
-
237
-
238
-
239
-
240
-
241
-
242
-
243
-
244
-
245
-
246
-
247
-
248
-
249
-
250
 |
 |

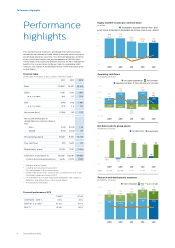
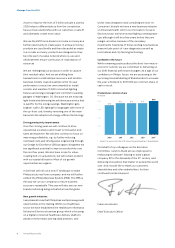
Performance highlights
Annual Report 2013 5
Employee Engagement Index
in % ■-favorable--■-neutral--■-unfavorable
100
75
50
25
0
2009
71
15
14
2010
77
12
11
2011
76
14
10
20124)
79
15 6
2013
75
16
9
Operational carbon footprint
in kilotonnes CO2-equivalent
■-logistics_■-business travel
■-non-industrial operations_■-manufacturing
2,500
2,000
1,500
1,000
500
0
2009
627
220
174
909
1,930
2010
672
247
159
767
1,845
2011
657
256
155
703
1,771
2012
546
217
142
709
1,614
2013
575
227
114
738
1,654
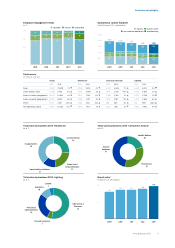
Performance
in millions of euros
Group Healthcare Consumer Lifestyle Lighting
2012 2013 2012 2013 2012 2013 2012 2013
Sales 23,457 23,329 1% 9,983 9,575 4% 4,139 4,605 7% 8,442 8,413 0%
Green product sales 10,981 11,815 8% 3,610 3,690 2% 1,619 2,270 40% 5,572 5,855 2%
Sales in mature geographies5) 15,407 14,825 4% 7,615 7,154 6% 2,365 2,418 2% 5,010 4,758 5%
Sales in growth geographies5) 8,050 8,504 6% 2,368 2,421 2% 1,954 2,187 12% 3,432 3,655 6%
EBITA 1,106 2,451 122% 1,226 1,512 23% 456 483 6% 128 695 443%
Net operating capital 9,316 10,238 10% 7,976 7,437 7% 1,205 1,261 5% 4,635 4,462 4%
Total sales by business 2013: Healthcare
as a %
Customer Services
26
Patient Care &
Clinical Informatics
22
Home Healthcare Solutions
14
Imaging Systems
38
Total sales by business 2013: Consumer Lifestyle
as a %
Health & Wellness
20
Personal Care
33
Domestic
Appliances
47
Total sales by business 2013: Lighting
as a %
Light Sources &
Electronics
52
Consumer Luminaires
5
Professional
Lighting Solutions
28
Automotive
10
Lumileds
5
Brand value6)
in billions of US dollars
10
5
0
8.1
2009
8.7
2010
8.7
2011
9.0
2012
9.8
2013