Philips 2013 Annual Report Download - page 176
Download and view the complete annual report
Please find page 176 of the 2013 Philips annual report below. You can navigate through the pages in the report by either clicking on the pages listed below, or by using the keyword search tool below to find specific information within the annual report.-
 1
1 -
2
-
3
-
4
-
5
-
6
-
7
-
8
-
9
-
10
-
11
-
12
-
13
-
14
-
15
-
16
-
17
-
18
-
19
-
20
-
21
-
22
-
23
-
24
-
25
-
26
-
27
-
28
-
29
-
30
-
31
-
32
-
33
-
34
-
35
-
36
-
37
-
38
-
39
-
40
-
41
-
42
-
43
-
44
-
45
-
46
-
47
-
48
-
49
-
50
-
51
-
52
-
53
-
54
-
55
-
56
-
57
-
58
-
59
-
60
-
61
-
62
-
63
-
64
-
65
-
66
-
67
-
68
-
69
-
70
-
71
-
72
-
73
-
74
-
75
-
76
-
77
-
78
-
79
-
80
-
81
-
82
-
83
-
84
-
85
-
86
-
87
-
88
-
89
-
90
-
91
-
92
-
93
-
94
-
95
-
96
-
97
-
98
-
99
-
100
-
101
-
102
-
103
-
104
-
105
-
106
-
107
-
108
-
109
-
110
-
111
-
112
-
113
-
114
-
115
-
116
-
117
-
118
-
119
-
120
-
121
-
122
-
123
-
124
-
125
-
126
-
127
-
128
-
129
-
130
-
131
-
132
-
133
-
134
-
135
-
136
-
137
-
138
-
139
-
140
-
141
-
142
-
143
-
144
-
145
-
146
-
147
-
148
-
149
-
150
-
151
-
152
-
153
-
154
-
155
-
156
-
157
-
158
-
159
-
160
-
161
-
162
-
163
-
164
-
165
-
 166
166 -
 167
167 -
 168
168 -
 169
169 -
 170
170 -
 171
171 -
 172
172 -
 173
173 -
 174
174 -
 175
175 -
 176
176 -
 177
177 -
 178
178 -
 179
179 -
 180
180 -
 181
181 -
 182
182 -
 183
183 -
 184
184 -
 185
185 -
 186
186 -
187
-
188
-
189
-
190
-
191
-
192
-
193
-
194
-
195
-
196
-
197
-
198
-
199
-
200
-
201
-
202
-
203
-
204
-
205
-
206
-
207
-
208
-
209
-
210
-
211
-
212
-
213
-
214
-
215
-
216
-
217
-
218
-
219
-
220
-
221
-
222
-
223
-
224
-
225
-
226
-
227
-
228
-
229
-
230
-
231
-
232
-
233
-
234
-
235
-
236
-
237
-
238
-
239
-
240
-
241
-
242
-
243
-
244
-
245
-
246
-
247
-
248
-
249
-
250
 |
 |

11 Group financial statements 11.9 - 11.9
176 Annual Report 2013
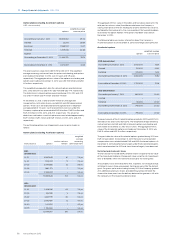
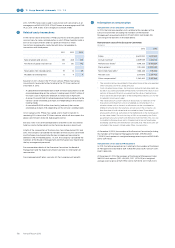
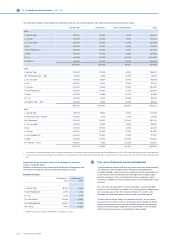
Option plans (excluding Accelerate! options)
USD-denominated
options
weighted average
exercise price
Outstanding at January 1, 2013 16,606,652 29.04
Granted 22,275 28.69
Exercised 1,969,901 23.27
Forfeited 1,209,456 30.66
Expired − −
Outstanding at December 31, 2013 13,449,570 29.74
Exercisable at December 31, 2013 8,313,489 33.26
The exercise prices range from USD 16.76 to USD 44.15. The weighted
average remaining contractual term for options outstanding and options
exercisable at December 31, 2013, was 5.4 years and 3.9 years,
respectively. The aggregate intrinsic value of the options outstanding and
options exercisable at December 31, 2013, was USD 106 million and USD
40 million, respectively.
The weighted average grant-date fair value of options granted during
2013, 2012 and 2011 was USD 6.70, USD 4.56 and USD 7.47, respectively.
The total intrinsic value of options exercised during 2013, 2012 and 2011
was USD 17 million, USD 4 million and USD 4 million.
At December 31, 2013, a total of EUR 9 million of unrecognized
compensation costs relate to non-vested EUR and USD denominated
options. These costs are expected to be recognized over a weighted-
average period of 1.0 years. Cash received from exercises under the
Company’s option plans amounted to EUR 84 million, EUR 19 million and
EUR 20 million in 2013, 2012, and 2011, respectively. The actual tax
deductions realized as a result of option exercises totaled approximately
EUR 5 million, EUR 1 million and EUR 1 million, in 2013, 2012, and 2011,
respectively.
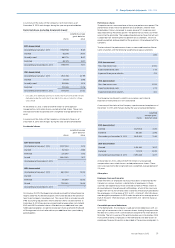
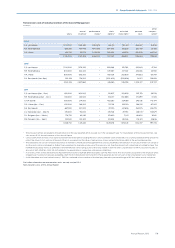
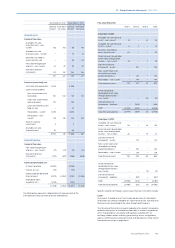
The outstanding options are categorized in exercise price ranges as
follows:
Option plans (excluding Accelerate! options)
exercise price options
intrinsic value in
millions
weighted
average
remaining
contractual term
EUR-
denominated
10-15 4,967,645 61 7.4 yrs
15-20 1,104,222 9 2.5 yrs
20-25 8,547,886 33 5.6 yrs
25-30 1,693,773 1 2.3 yrs
30-35 2,344,302 − 3.3 yrs
18,657,828 104 5.3 yrs
USD-
denominated
15-20 3,406,981 62 7.6 yrs
20-25 335,769 5 7.8 yrs
25-30 3,220,919 26 5.3 yrs
30-35 2,943,429 12 4.7 yrs
35-40 1,813,212 1 4.2 yrs
40-55 1,729,260 − 3.3 yrs
13,449,570 106 5.4 yrs
The aggregate intrinsic value in the tables and text above represents the
total pre-tax intrinsic value (the dierence between the Company’s
closing share price on the last trading day of 2013 and the exercise price,
multiplied by the number of in-the-money options) that would have been
received by the option holders if the options had been exercised on
December 31, 2013.
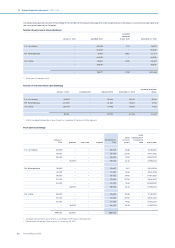
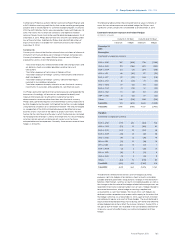
The following table summarizes information about the Company’s
Accelerate! options as of December 31, 2013 and changes during the year:
Accelerate! options
options
weighted average
exercise price
EUR-denominated
Outstanding at January 1, 2013 2,927,000 15.24
Granted 152,000 22.43
Forfeited 225,000 15.24
Outstanding at December 31, 2013 2,854,000 15.62
Exercisable at December 31, 2013 2,722,000 15.29
USD-denominated
Outstanding at January 1, 2013 860,000 20.02
Granted − −
Forfeited 65,000 20.02
Outstanding at December 31, 2013 795,000 20.02
Exercisable at December 31, 2013 795,000 20.02
The exercise price of the Accelerate! options granted in 2012 are EUR 15.24
and USD 20.02 and in 2013 EUR 22.43. The weighted average remaining
contractual term for EUR and USD Accelerate! options outstanding and
exercisable at December 31, 2013 was 8.1 years. The aggregate intrinsic
value of the Accelerate! options outstanding at December 31, 2013, was
EUR 31 million and USD 13 million, respectively.
The grant-date fair value of Accelerate! options granted during 2013 was
EUR 4.41 per option. At December 31, 2013 there are no unrecognized
compensation costs related to both EUR and USD Accelerate! options. At
December 31, 2013 all performance targets under the Accelerate! program,
which were based on the 2013 mid-term financial targets, have been met.
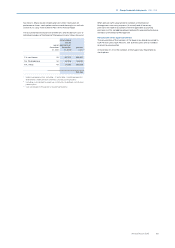
Restricted and Accelerate! shares
The fair value of restricted and Accelerate! shares is equal to the fair value
of the share at grant date less the present value, using the risk-free interest
rate, of dividends which will not be received up to the vesting date.
The Company issues restricted shares that, in general, vest in equal annual
installments over a three-year period, starting one year after the date of
grant. For grants up to and including January 2013 the Company granted
20% additional (premium) shares, provided the grantee still holds the
shares after three years from the delivery date and the grantee is still with
the Company on the respective delivery dates.