Philips 2013 Annual Report Download - page 208
Download and view the complete annual report
Please find page 208 of the 2013 Philips annual report below. You can navigate through the pages in the report by either clicking on the pages listed below, or by using the keyword search tool below to find specific information within the annual report.-
 1
1 -
2
-
3
-
4
-
5
-
6
-
7
-
8
-
9
-
10
-
11
-
12
-
13
-
14
-
15
-
16
-
17
-
18
-
19
-
20
-
21
-
22
-
23
-
24
-
25
-
26
-
27
-
28
-
29
-
30
-
31
-
32
-
33
-
34
-
35
-
36
-
37
-
38
-
39
-
40
-
41
-
42
-
43
-
44
-
45
-
46
-
47
-
48
-
49
-
50
-
51
-
52
-
53
-
54
-
55
-
56
-
57
-
58
-
59
-
60
-
61
-
62
-
63
-
64
-
65
-
66
-
67
-
68
-
69
-
70
-
71
-
72
-
73
-
74
-
75
-
76
-
77
-
78
-
79
-
80
-
81
-
82
-
83
-
84
-
85
-
86
-
87
-
88
-
89
-
90
-
91
-
92
-
93
-
94
-
95
-
96
-
97
-
98
-
99
-
100
-
101
-
102
-
103
-
104
-
105
-
106
-
107
-
108
-
109
-
110
-
111
-
112
-
113
-
114
-
115
-
116
-
117
-
118
-
119
-
120
-
121
-
122
-
123
-
124
-
125
-
126
-
127
-
128
-
129
-
130
-
131
-
132
-
133
-
134
-
135
-
136
-
137
-
138
-
139
-
140
-
141
-
142
-
143
-
144
-
145
-
146
-
147
-
148
-
149
-
150
-
151
-
152
-
153
-
154
-
155
-
156
-
157
-
158
-
159
-
160
-
161
-
162
-
163
-
164
-
165
-
166
-
167
-
168
-
169
-
170
-
171
-
172
-
173
-
174
-
175
-
176
-
177
-
178
-
179
-
180
-
181
-
182
-
183
-
184
-
185
-
186
-
187
-
188
-
189
-
190
-
191
-
192
-
193
-
194
-
195
-
196
-
197
-
 198
198 -
 199
199 -
 200
200 -
 201
201 -
 202
202 -
 203
203 -
 204
204 -
 205
205 -
 206
206 -
 207
207 -
 208
208 -
 209
209 -
 210
210 -
 211
211 -
 212
212 -
 213
213 -
 214
214 -
 215
215 -
 216
216 -
 217
217 -
 218
218 -
219
-
220
-
221
-
222
-
223
-
224
-
225
-
226
-
227
-
228
-
229
-
230
-
231
-
232
-
233
-
234
-
235
-
236
-
237
-
238
-
239
-
240
-
241
-
242
-
243
-
244
-
245
-
246
-
247
-
248
-
249
-
250
 |
 |

13 Sustainability statements 13.2.2 - 13.3.1
208 Annual Report 2013
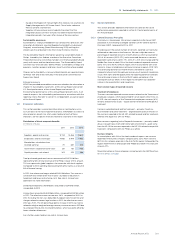
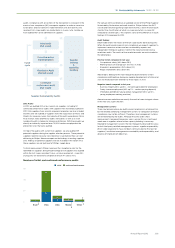
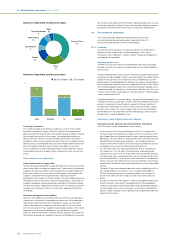
Number of identified smelters per region
Asia excl. China
74
China
42
Europe
24
South America
11
North America
19
Russian Federation
11
Others
10
Number of identified smelters per metal
■-Not CFS compliant--■-CFS compliant
100
0
58
29
Gold
2
19
Tantalum
55
8
Tin 0
20
Tungsten
Tin mining in Indonesia
The islands of Bangka and Belitung, Indonesia, are one of the world’s
principal tin-producing regions. Recently concerns have been raised
about environmental devastation and unsafe working conditions related
to the illegal mining of tin in this region. To evaluate possibilities for
addressing these concerns, Philips teamed up with other frontrunner
companies, the tin industry and civil society in the new IDH Indonesian Tin
Working Group, coordinated by the Dutch Sustainable Trade Initiative IDH.
We co-funded a situational analysis and sustainability assessment
commissioned by this working group to better understand the situation
and the potential ways for downstream companies to take constructive
action.
Other initiatives in our supply chain
Carbon footprint of our supply chain
Society has a pressing need to manage and reduce CO2 emissions over the
whole value chain, including at supplier level. Therefore 80 of the largest
suppliers to Philips have been invited to report their carbon footprint as
part of the Carbon Disclosure Project (CDP) Supply Chain program. 69
suppliers completed the full questionnaire, showing increased
performance with respect to climate change. This year, Philips became a
founding member of the CDP Action Exchange program, connecting our
suppliers to globally recognized solutions providers in the field of energy-
efficient technology, helping them in their search for innovative solutions
to reduce their future emissions, for instance by applying LED lighting
technology.
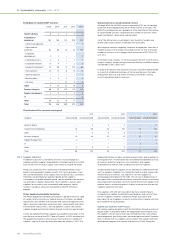
Substance management with suppliers
We work with suppliers to eliminate and minimize the use of hazardous
substances in our products and production processes. Since regulatory
requirements aecting electronics frequently change, we structurally
collect information from suppliers in an online tool (BOMcheck) since
2010, in particular for those suppliers that provide materials which could
represent a risk in terms of compliance, e.g. soft plastics, complex
materials, and ROHS-relevant materials. Philips validates the substance
declarations received from suppliers to ensure that the products we put on
the market are compliant with the Philips Regulated Substances List and
all relevant legislation. During 2013 we collected and validated substance
declarations for nearly 95% of all relevant components and products.
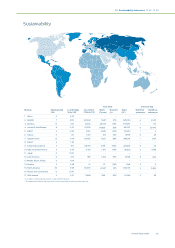
13.3 Environmental statements
This section provides additional information on (some of) the
environmental performance parameters reported section 4.3,
Environmental performance, of this Annual Report.
13.3.1 EcoVision
Our latest EcoVision program, includes key performance indicators in
relation to Green Product sales, Improving people’s lives, Green
Innovation, Green Operations, Health & Safety, Employee Engagement
and Supplier Sustainability.
Improving people’s lives
At Philips, we strive to make the world healthier and more sustainable
through innovation. Our goal is to improve the lives of 3 billion people a
year by 2025.
Through Philips products and solutions that directly support the curative
or preventive side of people’s health, we improved the lives of 630 million
people in 2013, driven by our Healthcare sector. Additionally, our well-
being products that help people live a healthy life, and our Green Products
that contribute to a healthy ecosystem, improved the lives of 290 million
and 1.49 billion people respectively. After the elimination of double counts
- people touched multiple times - we arrived at 1.8 billion lives. This is an
increase of 100 million compared to our total baseline of 1.7 billion people
a year, established in 2012.
Examples of products in the ‘well-being’ category that help people live a
healthier life are juicers, blenders, air fryers, but also mother and childcare
products. Examples of Green Products, products oering a significant
environmental improvement in one or more Green Focal Areas, can be
found in sub-section 4.3.2, Green Product sales, of this Annual Report.
Further details on this parameter and the methodology can be found in
the document ‘Improving people’s lives’.
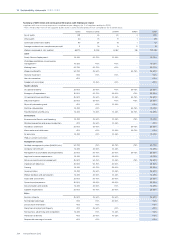
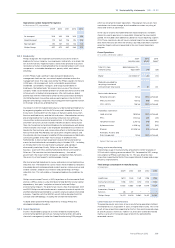
Operational carbon footprint and energy efficiency
Operational energy efficiency and carbon footprint: 2013 details
The 2013 results can be attributed to several factors:
• Accounting for 45% of the total footprint, total CO2 emissions from
manufacturing increased due the higher use of SF6 (a substance with
high Global Warming Potential impact) in our Lighting manufacturing
operations. This was, however, partly oset by our continued focus on
energy efficiency improvement programs, our changing industrial
footprint, the further increase of the share of purchased electricity from
renewable sources to 50% of total purchased electricity.
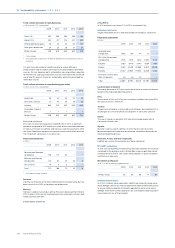
• CO2 emissions from non-industrial operations (offices, warehouses,
etc.) represent 7% of the total. The overall floor space decreased
significantly in 2013 as a result of our Work Place Innovation program,
which promotes flex-working and thus reduces the floor space in our
real estate portfolio. As a result, emissions reduced 20% compared to
2012 as we also continued to focus on the most efficient use of facility
space and increased the share of purchased electricity from renewable
sources.
• The total CO2 emissions related to business travel, accounting for 14% of
our carbon footprint, increased 5%. This is mainly attributable to
Philips’ increasing presence in emerging markets. Our stringent in-
house travel policy remains in place, as does our Green Lease Car
policy.
• Overall CO2 emissions from logistics, representing approximately one
third of the total, increased 5% compared to 2012. We recorded an
increase in sea freight, confirming the eect of our gatekeeping process
to move freight from air to sea. However, increased air shipments to
address supply shortages in our Lighting sector mitigated the reduction
realized by this policy.