Philips 2013 Annual Report Download - page 231
Download and view the complete annual report
Please find page 231 of the 2013 Philips annual report below. You can navigate through the pages in the report by either clicking on the pages listed below, or by using the keyword search tool below to find specific information within the annual report.-
 1
1 -
2
-
3
-
4
-
5
-
6
-
7
-
8
-
9
-
10
-
11
-
12
-
13
-
14
-
15
-
16
-
17
-
18
-
19
-
20
-
21
-
22
-
23
-
24
-
25
-
26
-
27
-
28
-
29
-
30
-
31
-
32
-
33
-
34
-
35
-
36
-
37
-
38
-
39
-
40
-
41
-
42
-
43
-
44
-
45
-
46
-
47
-
48
-
49
-
50
-
51
-
52
-
53
-
54
-
55
-
56
-
57
-
58
-
59
-
60
-
61
-
62
-
63
-
64
-
65
-
66
-
67
-
68
-
69
-
70
-
71
-
72
-
73
-
74
-
75
-
76
-
77
-
78
-
79
-
80
-
81
-
82
-
83
-
84
-
85
-
86
-
87
-
88
-
89
-
90
-
91
-
92
-
93
-
94
-
95
-
96
-
97
-
98
-
99
-
100
-
101
-
102
-
103
-
104
-
105
-
106
-
107
-
108
-
109
-
110
-
111
-
112
-
113
-
114
-
115
-
116
-
117
-
118
-
119
-
120
-
121
-
122
-
123
-
124
-
125
-
126
-
127
-
128
-
129
-
130
-
131
-
132
-
133
-
134
-
135
-
136
-
137
-
138
-
139
-
140
-
141
-
142
-
143
-
144
-
145
-
146
-
147
-
148
-
149
-
150
-
151
-
152
-
153
-
154
-
155
-
156
-
157
-
158
-
159
-
160
-
161
-
162
-
163
-
164
-
165
-
166
-
167
-
168
-
169
-
170
-
171
-
172
-
173
-
174
-
175
-
176
-
177
-
178
-
179
-
180
-
181
-
182
-
183
-
184
-
185
-
186
-
187
-
188
-
189
-
190
-
191
-
192
-
193
-
194
-
195
-
196
-
197
-
198
-
199
-
200
-
201
-
202
-
203
-
204
-
205
-
206
-
207
-
208
-
209
-
210
-
211
-
212
-
213
-
214
-
215
-
216
-
217
-
218
-
219
-
220
-
 221
221 -
 222
222 -
 223
223 -
 224
224 -
 225
225 -
 226
226 -
 227
227 -
 228
228 -
 229
229 -
 230
230 -
 231
231 -
 232
232 -
 233
233 -
 234
234 -
 235
235 -
 236
236 -
 237
237 -
 238
238 -
 239
239 -
 240
240 -
 241
241 -
242
-
243
-
244
-
245
-
246
-
247
-
248
-
249
-
250
 |
 |

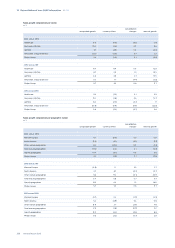
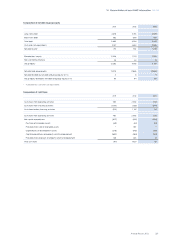
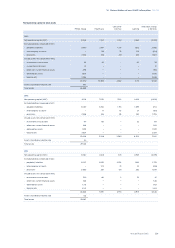
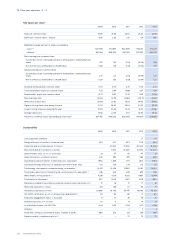
15 Five-year overview 15 - 15
Annual Report 2013 231
Capital employed
2009 2010 2011 2012 2013
Cash and cash equivalents 4,386 5,833 3,147 3,834 2,465
Receivables and other current assets 4,966 5,324 5,570 5,156 5,262
Assets classified as held for sale − 120 551 43 507
Inventories 2,913 3,865 3,625 3,495 3,240
Non-current financial assets/investments in associates 972 660 549 726 657
Non-current receivables/assets 2,885 1,532 1,929 2,189 1,882
Property, plant and equipment 3,252 3,145 3,014 2,959 2,780
Intangible assets 11,523 12,233 11,012 10,679 9,766
Total assets 30,897 32,712 29,397 29,081 26,559
Property, plant and equipment:
Capital expenditures for the year 444 555 640 661 587
Depreciation for the year 686 612 617 678 632
Capital expenditures : depreciation 0.6 0.9 1.0 1.0 0.9
Inventories as a % of sales1) 14.5 16.0 16.5 14.3 13.9
Outstanding trade receivables, in days sales1) 50 56 54 50 52
Financial structure
2009 2010 2011 2012 2013
Other liabilities 9,523 10,610 10,434 10,379 8,529
Liabilities directly associated with assets held for sale − − 61 27 348
Debt 4,267 4,658 3,860 4,534 3,901
Provisions 2,476 2,377 2,680 2,956 2,554
Total provisions and liabilities 16,266 17,645 17,035 17,896 15,332
Shareholders’ equity 14,582 15,021 12,328 11,151 11,214
Non-controlling interests 49 46 34 34 13
Group equity and liabilities 30,897 32,712 29,397 29,081 26,559
Net debt : group equity ratio (1):101 (8):108 5:95 6:94 11:89
Market capitalization at year-end 19,180 21,694 15,077 18,200 24,340