Philips 2013 Annual Report Download - page 168
Download and view the complete annual report
Please find page 168 of the 2013 Philips annual report below. You can navigate through the pages in the report by either clicking on the pages listed below, or by using the keyword search tool below to find specific information within the annual report.-
 1
1 -
2
-
3
-
4
-
5
-
6
-
7
-
8
-
9
-
10
-
11
-
12
-
13
-
14
-
15
-
16
-
17
-
18
-
19
-
20
-
21
-
22
-
23
-
24
-
25
-
26
-
27
-
28
-
29
-
30
-
31
-
32
-
33
-
34
-
35
-
36
-
37
-
38
-
39
-
40
-
41
-
42
-
43
-
44
-
45
-
46
-
47
-
48
-
49
-
50
-
51
-
52
-
53
-
54
-
55
-
56
-
57
-
58
-
59
-
60
-
61
-
62
-
63
-
64
-
65
-
66
-
67
-
68
-
69
-
70
-
71
-
72
-
73
-
74
-
75
-
76
-
77
-
78
-
79
-
80
-
81
-
82
-
83
-
84
-
85
-
86
-
87
-
88
-
89
-
90
-
91
-
92
-
93
-
94
-
95
-
96
-
97
-
98
-
99
-
100
-
101
-
102
-
103
-
104
-
105
-
106
-
107
-
108
-
109
-
110
-
111
-
112
-
113
-
114
-
115
-
116
-
117
-
118
-
119
-
120
-
121
-
122
-
123
-
124
-
125
-
126
-
127
-
128
-
129
-
130
-
131
-
132
-
133
-
134
-
135
-
136
-
137
-
138
-
139
-
140
-
141
-
142
-
143
-
144
-
145
-
146
-
147
-
148
-
149
-
150
-
151
-
152
-
153
-
154
-
155
-
156
-
157
-
 158
158 -
 159
159 -
 160
160 -
 161
161 -
 162
162 -
 163
163 -
 164
164 -
 165
165 -
 166
166 -
 167
167 -
 168
168 -
 169
169 -
 170
170 -
 171
171 -
 172
172 -
 173
173 -
 174
174 -
 175
175 -
 176
176 -
 177
177 -
 178
178 -
179
-
180
-
181
-
182
-
183
-
184
-
185
-
186
-
187
-
188
-
189
-
190
-
191
-
192
-
193
-
194
-
195
-
196
-
197
-
198
-
199
-
200
-
201
-
202
-
203
-
204
-
205
-
206
-
207
-
208
-
209
-
210
-
211
-
212
-
213
-
214
-
215
-
216
-
217
-
218
-
219
-
220
-
221
-
222
-
223
-
224
-
225
-
226
-
227
-
228
-
229
-
230
-
231
-
232
-
233
-
234
-
235
-
236
-
237
-
238
-
239
-
240
-
241
-
242
-
243
-
244
-
245
-
246
-
247
-
248
-
249
-
250
 |
 |
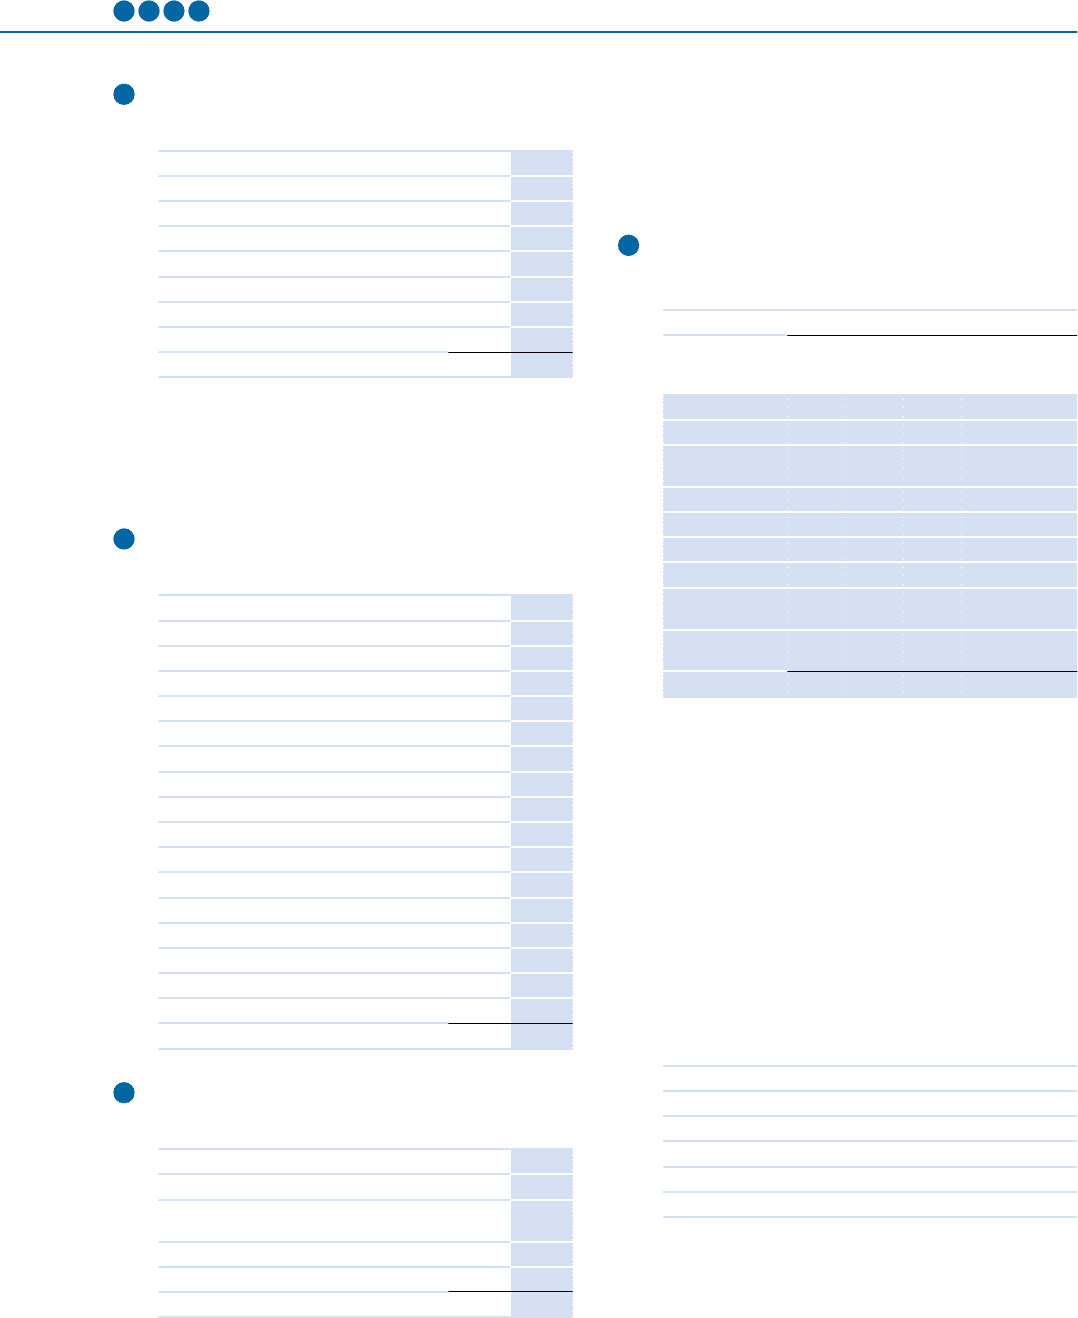
22 23 24 25 11 Group financial statements 11.9 - 11.9
168 Annual Report 2013
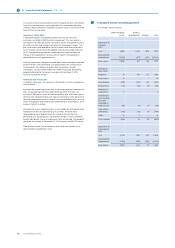
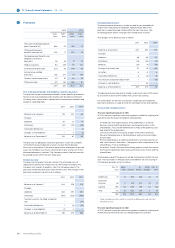
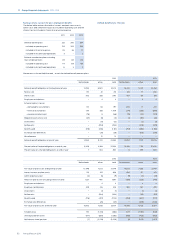
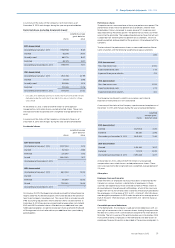
22 Other non-current liabilities
Other non-current liabilities are summarized as follows:
2012 2013
Accrued pension costs 1,166 813
Income tax payable − 1
Decommissioning cost 23 −
Deferred income 194 214
Other tax liability 488 443
Other liabilities 134 97
2,005 1,568
The decrease in the accrued pension costs is mainly attributable to the US
defined benefit plan. See also note 30, Post-employment benefits.
In 2013, liabilities related to decommissioning cost were reclassified from
(non)current liabilities to other provisions.
For further details on tax related liabilities refer to note 5, Income taxes.
23 Accrued liabilities
Accrued liabilities are summarized as follows:
2012 2013
Personnel-related costs:
- Salaries and wages 590 560
- Accrued holiday entitlements 192 184
- Other personnel-related costs 148 130
Fixed-asset-related costs:
- Gas, water, electricity, rent and other 69 61
Distribution costs 114 104
Sales-related costs:
- Commission payable 52 24
- Advertising and marketing-related costs 149 159
- Other sales-related costs 118 98
Material-related costs 186 175
Interest-related accruals 75 57
Deferred income 824 812
Other accrued liabilities 654 466
3,171 2,830
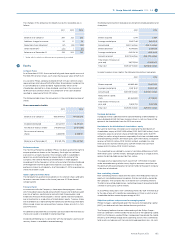
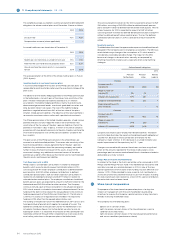
24 Other current liabilities
Other current liabilities are summarized as follows:
2012 2013
Advances received from customers on orders not
covered by work in process 308 240
Other taxes including social security premiums 176 193
Other liabilities 1,071 649
1,555 1,082
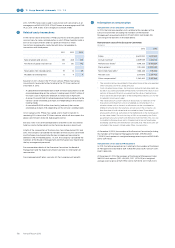
Other liabilities include EUR 530 million (2012: EUR 442 million) accrued
customer rebates that cannot be oset with accounts receivables for
those customers.
On December 5, 2012 the Company announced that it received a fine of
EUR 313 million from the European Commission following an investigation
into alleged violation of competition rules in the Cathode-Ray Tubes
(CRT) industry. In addition, the European Commission has ordered Philips
and LG Electronics to be jointly and severally liable to pay a fine of EUR
392 million for an alleged violation of competition rules by LG.Philips
Displays (LPD), a 50/50 joint venture between the Company and LG
Electronics. In 2006, LPD went bankrupt. The aggregate of the amount of
EUR 313 million and EUR 196 million (being 50% of the fine related to LPD)
has been recorded under Other liabilities in December 2012 and paid in Q1
2013.
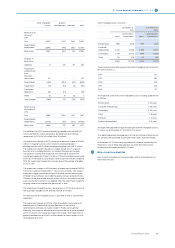
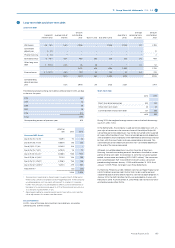
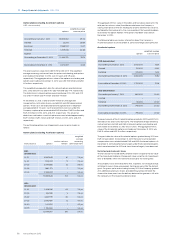
25 Contractual obligations
Contractual cash obligations at December 31, 20131)
payments due by period
total
less
than 1
year
1-3
years
3-5
years
after 5
years
Long-term debt2) 3,472 308 2 900 2,262
Finance lease
obligations 241 61 78 34 68
Short-term debt 230 230 − − −
Operating leases 1,017 237 316 182 282
Derivative liabilities 337 112 93 92 40
Interest on debt3) 2,421 185 346 315 1,575
Purchase
obligations4) 184 81 76 26 1
Trade and other
payables 2,462 2,462 − − −
10,364 3,676 911 1,549 4,228
1) Data in this table is undiscounted
2) Long-term debt includes short-term portion of long-term debt and
excludes finance lease obligations
3) Approximately 20% of the debt bears interest at a floating rate. Majority of
the interest payments on variable interest rate loans in the table above
reflect market forward interest rates at the period end and these amounts
may change as market interest rate changes
4) Philips has commitments related to the ordinary course of business which
in general relate to contracts and purchase order commitments for less
than 12 months. In the table, only the commitments for multiple years are
presented, including their short-term portion
The long-term operating lease commitments are mainly related to the
rental of buildings. A number of these leases originate from sale-and-
leaseback arrangements. Operating lease payments under sale-and-
leaseback arrangements for 2013 totaled EUR 42 million (2012: EUR 35
million).
The remaining minimum payments from operating leases originating from
sale-and-leaseback arrangements are as follows:
2014 42
2015 37
2016 36
2017 35
2018 34
Thereafter 171