Philips 2013 Annual Report Download - page 42
Download and view the complete annual report
Please find page 42 of the 2013 Philips annual report below. You can navigate through the pages in the report by either clicking on the pages listed below, or by using the keyword search tool below to find specific information within the annual report.-
 1
1 -
2
-
3
-
4
-
5
-
6
-
7
-
8
-
9
-
10
-
11
-
12
-
13
-
14
-
15
-
16
-
17
-
18
-
19
-
20
-
21
-
22
-
23
-
24
-
25
-
26
-
27
-
28
-
29
-
30
-
31
-
 32
32 -
 33
33 -
 34
34 -
 35
35 -
 36
36 -
 37
37 -
 38
38 -
 39
39 -
 40
40 -
 41
41 -
 42
42 -
 43
43 -
 44
44 -
 45
45 -
 46
46 -
 47
47 -
 48
48 -
 49
49 -
 50
50 -
 51
51 -
 52
52 -
53
-
54
-
55
-
56
-
57
-
58
-
59
-
60
-
61
-
62
-
63
-
64
-
65
-
66
-
67
-
68
-
69
-
70
-
71
-
72
-
73
-
74
-
75
-
76
-
77
-
78
-
79
-
80
-
81
-
82
-
83
-
84
-
85
-
86
-
87
-
88
-
89
-
90
-
91
-
92
-
93
-
94
-
95
-
96
-
97
-
98
-
99
-
100
-
101
-
102
-
103
-
104
-
105
-
106
-
107
-
108
-
109
-
110
-
111
-
112
-
113
-
114
-
115
-
116
-
117
-
118
-
119
-
120
-
121
-
122
-
123
-
124
-
125
-
126
-
127
-
128
-
129
-
130
-
131
-
132
-
133
-
134
-
135
-
136
-
137
-
138
-
139
-
140
-
141
-
142
-
143
-
144
-
145
-
146
-
147
-
148
-
149
-
150
-
151
-
152
-
153
-
154
-
155
-
156
-
157
-
158
-
159
-
160
-
161
-
162
-
163
-
164
-
165
-
166
-
167
-
168
-
169
-
170
-
171
-
172
-
173
-
174
-
175
-
176
-
177
-
178
-
179
-
180
-
181
-
182
-
183
-
184
-
185
-
186
-
187
-
188
-
189
-
190
-
191
-
192
-
193
-
194
-
195
-
196
-
197
-
198
-
199
-
200
-
201
-
202
-
203
-
204
-
205
-
206
-
207
-
208
-
209
-
210
-
211
-
212
-
213
-
214
-
215
-
216
-
217
-
218
-
219
-
220
-
221
-
222
-
223
-
224
-
225
-
226
-
227
-
228
-
229
-
230
-
231
-
232
-
233
-
234
-
235
-
236
-
237
-
238
-
239
-
240
-
241
-
242
-
243
-
244
-
245
-
246
-
247
-
248
-
249
-
250
 |
 |

4 Group performance 4.1.3 - 4.1.5
42 Annual Report 2013
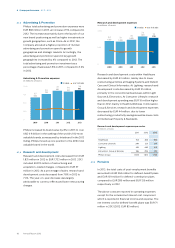
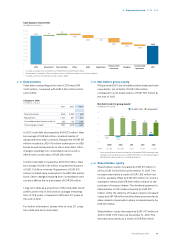
4.1.3 Advertising & Promotion
Philips’ total advertising and promotion expenses were
EUR 882 million in 2013, an increase of 5% compared to
2012. The increase was mainly due to the launch of our
new brand positioning as well as higher investments in
growth geographies, such as China. As in 2012, the
Company allocated a higher proportion of its total
advertising and promotion spend to growth
geographies and strategic markets. Accordingly, the
advertising and promotion spend in key growth
geographies increased by 4% compared to 2012. The
total advertising and promotion investment as a
percentage of sales was 3.8% in 2013, compared to 3.6%
in 2012.
Advertising & Promotion expenses
in millions of euros ■-in value----as a % of sales
1,000
750
500
250
0
3.7
666
2009
3.8
769
2010
4.1
865
2011
3.6
841
2012
3.8
882
2013
Philips increased its brand value by 8% in 2013 to over
USD 9.8 billion in the ranking of the world’s 100 most
valuable brands, as measured by Interbrand. In the 2013
listing, Philips moved up one position to the 40th most
valuable brand in the world.
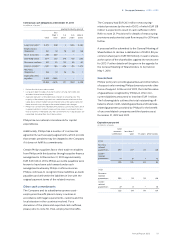
4.1.4 Research and development
Research and development costs decreased from EUR
1,831 million in 2012 to EUR 1,733 million in 2013. 2013
included EUR 15 million of restructuring and
acquisition-related charges, compared to EUR 57
million in 2012. As a percentage of sales, research and
development costs decreased from 7.8% in 2012 to
7.4%. The year-on-year decrease was largely
attributable to currency eects and lower restructuring
charges.
Research and development expenses
in millions of euros ■-in value----as a % of sales
2,200
1,100
0
8.4
1,526
2009
7.3
1,486
2010
7.6
1,605
2011
7.8
1,831
2012
7.4
1,733
2013
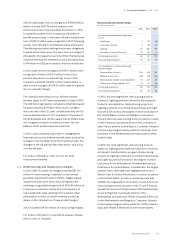
Research and development costs within Healthcare
decreased by EUR 43 million, mainly due to lower
restructuring activities at Imaging Systems and Patient
Care and Clinical Informatics. At Lighting, research and
development costs decreased by EUR 21 million,
primarily in the conventional businesses within Light
Sources & Electronics. At Consumer Lifestyle, research
and development spending was EUR 10 million higher
than in 2012, mainly in Health & Wellness. In Innovation,
Group & Services, research and development expenses
decreased by EUR 44 million, due to lower
restructuring, productivity savings as well as lower costs
at Intellectual Property & Standards.
Research and development expenses per sector
in millions of euros
2011 2012 2013
Healthcare 754 823 780
Consumer Lifestyle 249 251 261
Lighting 416 462 441
Innovation, Group & Services 186 295 251
Philips Group 1,605 1,831 1,733
4.1.5 Pensions
In 2013, the total costs of post-employment benefits
amounted to EUR 294 million for defined-benefit plans
and EUR 139 million for defined-contribution plans,
compared to EUR 289 million and EUR 139 million
respectively in 2012.
The above costs are reported in operating expenses
except for the included net interest cost component
which is reported in financial income and expense. The
net interest cost for defined-benefit plans was EUR 71
million in 2013 (2012: EUR 85 million).