Philips 2013 Annual Report Download - page 91
Download and view the complete annual report
Please find page 91 of the 2013 Philips annual report below. You can navigate through the pages in the report by either clicking on the pages listed below, or by using the keyword search tool below to find specific information within the annual report.-
 1
1 -
2
-
3
-
4
-
5
-
6
-
7
-
8
-
9
-
10
-
11
-
12
-
13
-
14
-
15
-
16
-
17
-
18
-
19
-
20
-
21
-
22
-
23
-
24
-
25
-
26
-
27
-
28
-
29
-
30
-
31
-
32
-
33
-
34
-
35
-
36
-
37
-
38
-
39
-
40
-
41
-
42
-
43
-
44
-
45
-
46
-
47
-
48
-
49
-
50
-
51
-
52
-
53
-
54
-
55
-
56
-
57
-
58
-
59
-
60
-
61
-
62
-
63
-
64
-
65
-
66
-
67
-
68
-
69
-
70
-
71
-
72
-
73
-
74
-
75
-
76
-
77
-
78
-
79
-
80
-
 81
81 -
 82
82 -
 83
83 -
 84
84 -
 85
85 -
 86
86 -
 87
87 -
 88
88 -
 89
89 -
 90
90 -
 91
91 -
 92
92 -
 93
93 -
 94
94 -
 95
95 -
 96
96 -
 97
97 -
 98
98 -
 99
99 -
 100
100 -
 101
101 -
102
-
103
-
104
-
105
-
106
-
107
-
108
-
109
-
110
-
111
-
112
-
113
-
114
-
115
-
116
-
117
-
118
-
119
-
120
-
121
-
122
-
123
-
124
-
125
-
126
-
127
-
128
-
129
-
130
-
131
-
132
-
133
-
134
-
135
-
136
-
137
-
138
-
139
-
140
-
141
-
142
-
143
-
144
-
145
-
146
-
147
-
148
-
149
-
150
-
151
-
152
-
153
-
154
-
155
-
156
-
157
-
158
-
159
-
160
-
161
-
162
-
163
-
164
-
165
-
166
-
167
-
168
-
169
-
170
-
171
-
172
-
173
-
174
-
175
-
176
-
177
-
178
-
179
-
180
-
181
-
182
-
183
-
184
-
185
-
186
-
187
-
188
-
189
-
190
-
191
-
192
-
193
-
194
-
195
-
196
-
197
-
198
-
199
-
200
-
201
-
202
-
203
-
204
-
205
-
206
-
207
-
208
-
209
-
210
-
211
-
212
-
213
-
214
-
215
-
216
-
217
-
218
-
219
-
220
-
221
-
222
-
223
-
224
-
225
-
226
-
227
-
228
-
229
-
230
-
231
-
232
-
233
-
234
-
235
-
236
-
237
-
238
-
239
-
240
-
241
-
242
-
243
-
244
-
245
-
246
-
247
-
248
-
249
-
250
 |
 |

5 Sector performance 5.4.1 - 5.4.2
Annual Report 2013 91
Accelerate! Investments
Innovation, Group & Services plays an important role in
the Accelerate! program, notably by helping to improve
the end-to-end value chain. The End-to-End approach
consists of three core processes: Idea-to-Market,
Market-to-Order, and Order-to-Cash. Innovation,
Group & Services supports a more efficient and eective
Idea-to-Market process in five focal areas: speeding up
time-to-market, portfolio optimization, driving
breakthrough innovation, improving innovation
competencies, and strengthening the position of
Philips as an innovation leader. Based on deeper
customer insights, and enhanced capability and
competency building, we are driving value more
eectively.
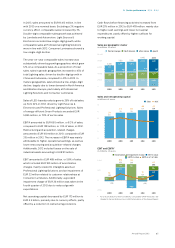
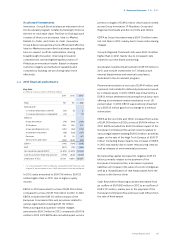
5.4.2 2013 financial performance
Key data
in millions of euros unless otherwise stated
2011 2012 2013
Sales 731 713 736
Sales growth
% increase (decrease), nominal (23) (2) 3
% increase (decrease), comparable1) (13) − (2)
EBITA of:
Group Innovation (78) (149) (134)
IP Royalties 262 253 312
Group and Regional costs (140) (161) (175)
Accelerate! investment (28) (128) (137)
Pensions 22 24 (41)
Service Units and other (235) (543) (64)
EBITA 1) (197) (704) (239)
EBIT (207) (712) (242)
Net operating capital (NOC)1) (3,875) (4,500) (2,922)
Cash flows before financing activities1) (1,159) (842) (2,101)
Employees (FTEs) 13,001 11,856 12,937
1) For a reconciliation to the most directly comparable GAAP measures, see
chapter 14, Reconciliation of non-GAAP information, of this Annual Report
In 2013, sales amounted to EUR 736 million, EUR 23
million higher than in 2012, due to higher royalty
income.
EBITA in 2013 amounted to a loss of EUR 239 million,
compared to a loss of EUR 704 million in 2012. In 2012,
EBITA included the EUR 313 million impact of the
European Commission fine and provisions related to
various legal matters totaling EUR 132 million.
Restructuring and acquisition-related charges
amounted to EUR 3 million in 2013, compared to EUR 56
million in 2012. 2013 EBITA also included a past-service
pension cost gain of EUR 6 million, which was recorded
across Group Innovation, IP Royalties, Group and
Regional Overheads and Service Units and Others.
EBITA at Group Innovation was a EUR 15 million lower
net cost than in 2012, mainly due to lower restructuring
charges.
Group & Regional Overhead costs were EUR 14 million
higher than in 2012, mainly due to increased costs
related to our new brand positioning.
Accelerate! investments amounted to EUR 137 million in
2013, and include investments in IT infrastructure,
internal departments and external consultancy
dedicated to the Accelerate! program.
Pensions amounted to a net cost of EUR 41 million, and
represent costs related to deferred pensioners covered
by company plans. In 2013, EBITA was impacted by a
EUR 31 million settlement loss arising from a lump-sum
oering to terminated vested employees in our US
pension plan. In 2012, EBITA was positively impacted
by a EUR 25 million gain from a change in a medical
retiree plan.
EBITA at Service Units and Other increased from a loss
of EUR 543 million in 2012 to a loss of EUR 64 million. In
2012, EBITA included the EUR 313 million impact of the
European Commission fine and provisions related to
various legal matters totaling EUR 132 million, as well as
a gain on the sale of the High Tech Campus of EUR 37
million. Excluding these impacts, the increase in EBITA
in 2013 was mainly due to lower restructuring costs as
well as releases of environmental provisions.
Net operating capital decreased to negative EUR 2.9
billion, primarily related to the payment of the
European Commission fine, a decrease in pension
liabilities, an increase in the value of currency hedges as
well as a reclassification of real estate assets from the
sectors to the Service Units.
Cash flows before financing activities decreased from
an outflow of EUR 842 million in 2012 to an outflow of
EUR 2,101 million, mainly due to the payment of the
European Commission fine and lower cash inflows from
the sale of fixed assets.