Philips 2013 Annual Report Download - page 232
Download and view the complete annual report
Please find page 232 of the 2013 Philips annual report below. You can navigate through the pages in the report by either clicking on the pages listed below, or by using the keyword search tool below to find specific information within the annual report.-
 1
1 -
2
-
3
-
4
-
5
-
6
-
7
-
8
-
9
-
10
-
11
-
12
-
13
-
14
-
15
-
16
-
17
-
18
-
19
-
20
-
21
-
22
-
23
-
24
-
25
-
26
-
27
-
28
-
29
-
30
-
31
-
32
-
33
-
34
-
35
-
36
-
37
-
38
-
39
-
40
-
41
-
42
-
43
-
44
-
45
-
46
-
47
-
48
-
49
-
50
-
51
-
52
-
53
-
54
-
55
-
56
-
57
-
58
-
59
-
60
-
61
-
62
-
63
-
64
-
65
-
66
-
67
-
68
-
69
-
70
-
71
-
72
-
73
-
74
-
75
-
76
-
77
-
78
-
79
-
80
-
81
-
82
-
83
-
84
-
85
-
86
-
87
-
88
-
89
-
90
-
91
-
92
-
93
-
94
-
95
-
96
-
97
-
98
-
99
-
100
-
101
-
102
-
103
-
104
-
105
-
106
-
107
-
108
-
109
-
110
-
111
-
112
-
113
-
114
-
115
-
116
-
117
-
118
-
119
-
120
-
121
-
122
-
123
-
124
-
125
-
126
-
127
-
128
-
129
-
130
-
131
-
132
-
133
-
134
-
135
-
136
-
137
-
138
-
139
-
140
-
141
-
142
-
143
-
144
-
145
-
146
-
147
-
148
-
149
-
150
-
151
-
152
-
153
-
154
-
155
-
156
-
157
-
158
-
159
-
160
-
161
-
162
-
163
-
164
-
165
-
166
-
167
-
168
-
169
-
170
-
171
-
172
-
173
-
174
-
175
-
176
-
177
-
178
-
179
-
180
-
181
-
182
-
183
-
184
-
185
-
186
-
187
-
188
-
189
-
190
-
191
-
192
-
193
-
194
-
195
-
196
-
197
-
198
-
199
-
200
-
201
-
202
-
203
-
204
-
205
-
206
-
207
-
208
-
209
-
210
-
211
-
212
-
213
-
214
-
215
-
216
-
217
-
218
-
219
-
220
-
221
-
 222
222 -
 223
223 -
 224
224 -
 225
225 -
 226
226 -
 227
227 -
 228
228 -
 229
229 -
 230
230 -
 231
231 -
 232
232 -
 233
233 -
 234
234 -
 235
235 -
 236
236 -
 237
237 -
 238
238 -
 239
239 -
 240
240 -
 241
241 -
 242
242 -
243
-
244
-
245
-
246
-
247
-
248
-
249
-
250
 |
 |

15 Five-year overview 15 - 15
232 Annual Report 2013
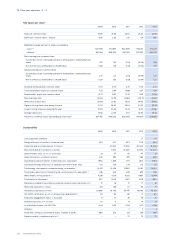
Key figures per share2)
2009 2010 2011 2012 2013
Sales per common share 19.56 21.68 22.03 25.44 25.61
EBITA per common share - diluted 0.87 2.30 1.50 1.19 2.66
Weighted average amount of shares outstanding:
- basic3,4) 927,709 941,691 952,809 922,101 911,072
- diluted3,4) 931,264 949,554 957,293 927,222 922,072
Basic earnings per common share:
Income (loss) from continuing operations attributable to shareholders per
share 0.17 1.22 (1.10) (0.09) 1.28
Net income (loss) attributable to shareholders 0.26 1.38 (1.53) (0.04) 1.28
Diluted earnings per common share:
Income (loss) from continuing operations attributable to shareholders per
share 0.17 1.21 (1.10) (0.09) 1.27
Net income (loss) attributable to shareholders 0.26 1.36 (1.53) (0.04) 1.27
Dividend distributed per common share 0.70 0.70 0.75 0.75 0.75
Total shareholder return per common share 7.55 2.94 (5.89) 4.37 7.50
Shareholders’ equity per common share 15.72 15.87 13.31 12.19 12.28
Price/earnings ratio 121.65 18.79 (14.80) (221.11) 20.82
Share price at year-end 20.68 22.92 16.28 19.90 26.65
Highest closing share price during the year 21.03 26.94 25.34 20.33 26.78
Lowest closing share price during the year 10.95 20.34 12.23 13.76 20.26
Average share price 15.26 23.35 18.11 16.92 23.33
Amount of common shares outstanding at year-end3) 927,457 946,506 926,095 914,591 913,338
Sustainability
2009 2010 2011 2012 2013
Lives improved, in billions 1.7 1.8
Energy efficiency of products, in lumen/watt 32.5 34.7 35.5 37.9 38.5
Collection and recycling amount, in tonnes 22,500 27,500 30,500 31,000
Recycled material in products, in tonnes 7,500 10,000 15,000 14,000
Green Product sales, as a % of total sales 33 37 40 47 51
Green Innovation, in millions of euros 340 392 479 569 509
Operational carbon footprint, in kilotonnes CO2-equivalent 1,930 1,845 1,771 1,614 1,654
Operational energy efficiency, in terajoules per million euro sales 1.34 1.29 1.24 1.15 1.21
Total energy consumption in manufacturing, in terajoules5) 14,421 14,426 13,982 14,421 14,160
Total carbon emissions in manufacturing, in kilotonnes CO2-equivalent 5) 816 675 635 691 705
Water intake, in thousands m3 5) 4,216 4,218 4,328 4,857 5,044
Total waste, in kilotonnes5) 97.7 104.6 94.0 87.6 92.0
Materials provided for recycling via external contractor per total waste, in % 77 78 77 77 81
Restricted substances, in kilos 272 188 111 55 9
Hazardous substances, in kilos 32,869 61,795 65,477 70,093 40,451
ISO 14001 certification, as a % of all reporting organizations5) 92 95 89 71 80
Employee Engagement Index, % favorable 71 77 76 79 75
Female executives, in % of total 10 11 13 14 15
Lost Workday Injuries, per 100 FTEs 0.44 0.50 0.38 0.31 0.28
Fatalities − − 2 7 3
Initial and continual conformance audits, number of audits 360 273 212 159 200
Suppliers audits, compliance rate, in % − − 72 75 77