Philips 2013 Annual Report Download - page 233
Download and view the complete annual report
Please find page 233 of the 2013 Philips annual report below. You can navigate through the pages in the report by either clicking on the pages listed below, or by using the keyword search tool below to find specific information within the annual report.-
 1
1 -
2
-
3
-
4
-
5
-
6
-
7
-
8
-
9
-
10
-
11
-
12
-
13
-
14
-
15
-
16
-
17
-
18
-
19
-
20
-
21
-
22
-
23
-
24
-
25
-
26
-
27
-
28
-
29
-
30
-
31
-
32
-
33
-
34
-
35
-
36
-
37
-
38
-
39
-
40
-
41
-
42
-
43
-
44
-
45
-
46
-
47
-
48
-
49
-
50
-
51
-
52
-
53
-
54
-
55
-
56
-
57
-
58
-
59
-
60
-
61
-
62
-
63
-
64
-
65
-
66
-
67
-
68
-
69
-
70
-
71
-
72
-
73
-
74
-
75
-
76
-
77
-
78
-
79
-
80
-
81
-
82
-
83
-
84
-
85
-
86
-
87
-
88
-
89
-
90
-
91
-
92
-
93
-
94
-
95
-
96
-
97
-
98
-
99
-
100
-
101
-
102
-
103
-
104
-
105
-
106
-
107
-
108
-
109
-
110
-
111
-
112
-
113
-
114
-
115
-
116
-
117
-
118
-
119
-
120
-
121
-
122
-
123
-
124
-
125
-
126
-
127
-
128
-
129
-
130
-
131
-
132
-
133
-
134
-
135
-
136
-
137
-
138
-
139
-
140
-
141
-
142
-
143
-
144
-
145
-
146
-
147
-
148
-
149
-
150
-
151
-
152
-
153
-
154
-
155
-
156
-
157
-
158
-
159
-
160
-
161
-
162
-
163
-
164
-
165
-
166
-
167
-
168
-
169
-
170
-
171
-
172
-
173
-
174
-
175
-
176
-
177
-
178
-
179
-
180
-
181
-
182
-
183
-
184
-
185
-
186
-
187
-
188
-
189
-
190
-
191
-
192
-
193
-
194
-
195
-
196
-
197
-
198
-
199
-
200
-
201
-
202
-
203
-
204
-
205
-
206
-
207
-
208
-
209
-
210
-
211
-
212
-
213
-
214
-
215
-
216
-
217
-
218
-
219
-
220
-
221
-
222
-
 223
223 -
 224
224 -
 225
225 -
 226
226 -
 227
227 -
 228
228 -
 229
229 -
 230
230 -
 231
231 -
 232
232 -
 233
233 -
 234
234 -
 235
235 -
 236
236 -
 237
237 -
 238
238 -
 239
239 -
 240
240 -
 241
241 -
 242
242 -
 243
243 -
244
-
245
-
246
-
247
-
248
-
249
-
250
 |
 |

16 Investor Relations 16 - 16.1
Annual Report 2013 233
16 Investor Relations
16.1 Key financials and
dividend policy
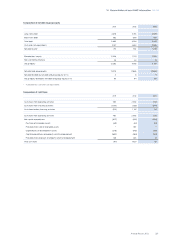
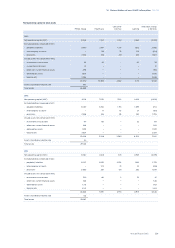
Prior-period financial statements have been restated
for the treatment of Audio, Video, Multimedia and
Accessories as discontinued operations (see note 7,
Discontinued operations and other assets classified as
held for sale) and the adoption of IAS 19R, which mainly
relates to pension reporting (see note 30, Post-
employment benefits).
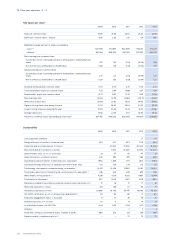
Key financials
Net income attributable to shareholders of the Philips
Group in 2013 showed a gain of EUR 1,169 million, or
EUR 1.27 per common share (diluted; basic EUR 1.28 per
common share). This compares to a loss of EUR 35
million, or EUR 0.04 per common share (diluted; basic
EUR 0.04 per common share), in 2012.
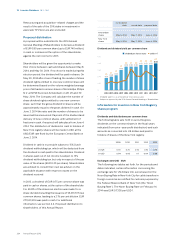
Net income attributable to shareholders
in millions of euros
■-net income attributable to shareholders
--per common share in euros - diluted
2,000
1,000
0
(1,000)
(2,000)
0.26
245
2009
1.36
1,295
2010
(1.53)
(1,460)
2011
(0.04)
(35)
2012
1.27
1,169
2013
EBIT and EBITA1)
in millions of euros
■-EBIT--■-Amortization and impairment--■
■-EBITA
3,000
2,500
2,000
1,500
1,000
500
0
(500)
377
430
807
2009
1,721
467
2,188
2010
(479)
1,914
1,435
2011
648
458
1,106
2012
1,991
460
2,451
2013
1) For a reconciliation to the most directly comparable GAAP measures, see
chapter 14, Reconciliation of non-GAAP information, of this Annual Report
Operating cash flows
in millions of euros
■-net capital expenditure_■
■-free cash flows1)
■-operating cash flows_--free cash flow as a % of sales
3,000
2,000
1,000
0
(1,000)
(2,000)
985
(574)
411
2.3
2009
1,931
(696)
1,235
6.0
2010
760
(857)
(97)
(0.5)
2011
2,082
(455)
1,627
6.9
2012
1,138
(966)
172
0.7
2013
1) For a reconciliation to the most directly comparable GAAP measures, see
chapter 14, Reconciliation of non-GAAP information, of this Annual Report
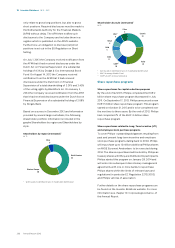
Dividend policy
We are committed to a stable dividend policy with a
40% to 50% target pay-out of continuing net income.
Continuing net income is the base figure used to
calculate the dividend payout for the year. For 2013, the
key exclusions from net income to arrive at continuing
net income are the following: the results related to the
Television and Audio, Video, Multimedia and
Accessories businesses of Consumer Lifestyle that are
shown as discontinued operations, the gains related to
past-service pension costs in the US and the settlement
loss arising from a lump sum oering to terminated
vested employees in the US pension plan, as well as the
impairment of goodwill in Lighting and of other
intangible assets in Healthcare and Lighting.