Philips 2013 Annual Report Download - page 148
Download and view the complete annual report
Please find page 148 of the 2013 Philips annual report below. You can navigate through the pages in the report by either clicking on the pages listed below, or by using the keyword search tool below to find specific information within the annual report.-
 1
1 -
2
-
3
-
4
-
5
-
6
-
7
-
8
-
9
-
10
-
11
-
12
-
13
-
14
-
15
-
16
-
17
-
18
-
19
-
20
-
21
-
22
-
23
-
24
-
25
-
26
-
27
-
28
-
29
-
30
-
31
-
32
-
33
-
34
-
35
-
36
-
37
-
38
-
39
-
40
-
41
-
42
-
43
-
44
-
45
-
46
-
47
-
48
-
49
-
50
-
51
-
52
-
53
-
54
-
55
-
56
-
57
-
58
-
59
-
60
-
61
-
62
-
63
-
64
-
65
-
66
-
67
-
68
-
69
-
70
-
71
-
72
-
73
-
74
-
75
-
76
-
77
-
78
-
79
-
80
-
81
-
82
-
83
-
84
-
85
-
86
-
87
-
88
-
89
-
90
-
91
-
92
-
93
-
94
-
95
-
96
-
97
-
98
-
99
-
100
-
101
-
102
-
103
-
104
-
105
-
106
-
107
-
108
-
109
-
110
-
111
-
112
-
113
-
114
-
115
-
116
-
117
-
118
-
119
-
120
-
121
-
122
-
123
-
124
-
125
-
126
-
127
-
128
-
129
-
130
-
131
-
132
-
133
-
134
-
135
-
136
-
137
-
 138
138 -
 139
139 -
 140
140 -
 141
141 -
 142
142 -
 143
143 -
 144
144 -
 145
145 -
 146
146 -
 147
147 -
 148
148 -
 149
149 -
 150
150 -
 151
151 -
 152
152 -
 153
153 -
 154
154 -
 155
155 -
 156
156 -
 157
157 -
 158
158 -
159
-
160
-
161
-
162
-
163
-
164
-
165
-
166
-
167
-
168
-
169
-
170
-
171
-
172
-
173
-
174
-
175
-
176
-
177
-
178
-
179
-
180
-
181
-
182
-
183
-
184
-
185
-
186
-
187
-
188
-
189
-
190
-
191
-
192
-
193
-
194
-
195
-
196
-
197
-
198
-
199
-
200
-
201
-
202
-
203
-
204
-
205
-
206
-
207
-
208
-
209
-
210
-
211
-
212
-
213
-
214
-
215
-
216
-
217
-
218
-
219
-
220
-
221
-
222
-
223
-
224
-
225
-
226
-
227
-
228
-
229
-
230
-
231
-
232
-
233
-
234
-
235
-
236
-
237
-
238
-
239
-
240
-
241
-
242
-
243
-
244
-
245
-
246
-
247
-
248
-
249
-
250
 |
 |

3 11 Group financial statements 11.9 - 11.9
148 Annual Report 2013
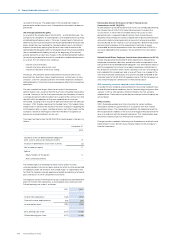
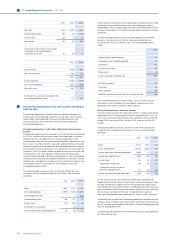
3Income from operations
For information related to Sales and tangible and intangible assets on a
geographical and sector basis, see note 2, Information by sector and main
country.
Sales and costs by nature
2011 2012 2013
Sales 20,992 23,457 23,329
Costs of materials used (7,119) (8,177) (7,895)
Employee benefit expenses (5,697) (6,694) (6,129)
Depreciation and amortization (1,400) (1,398) (1,349)
Shipping and handling (776) (788) (809)
Advertising and promotion (865) (841) (882)
Lease expense (314) (364) (347)1)
Other operational costs (3,993) (4,214) (3,987)
Impairment of goodwill (1,355) − (28)
Other business income and expenses 48 (333) 88
Income from operations (479) 648 1,991
1) Lease expense includes EUR 42 million of other costs, such as fuel and
electricity, and taxes to be paid and reimbursed to the lessor
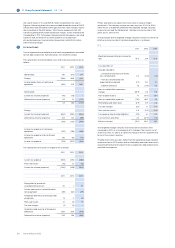
Sales composition
2011 2012 2013
Goods 17,636 19,918 19,716
Services 2,926 3,130 3,139
Royalties 430 409 474
20,992 23,457 23,329
Philips has no single external customer that represents 10% or more of
revenues.
Costs of materials used
Cost of materials used represents the inventory recognized in cost of sales.
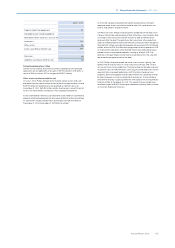
Employee benefit expenses
2011 2012 2013
Salaries and wages 4,668 5,499 4,983
Post-employment benefits costs 272 344 362
Other social security and similar
charges:
- Required by law 595 678 658
- Voluntary 162 173 126
5,697 6,694 6,129
The employee benefit expenses relate to employees who are on the
Philips payroll, both with permanent and temporary contracts.
For further information on pension costs, see note 30, Post-employment
benefits.
Details on the remuneration of the members of the Board of Management
and the Supervisory Board, see note 33, Information on remuneration.
Employees
The average number of employees by category is summarized as follows
(in FTEs):
2011 2012 2013
Production 57,011 58,031 58,116
Research and development 12,539 12,974 12,072
Other 31,789 32,730 32,006
Employees 101,339 103,735 102,194
3rd party workers 16,092 15,498 13,171
Continuing operations 117,431 119,233 115,365
Discontinued operations 6,100 2,901 1,997
Employees consist of those persons working on the payroll of Philips and
whose costs are reflected in the Employee benefit expenses table. 3rd
party workers consist of personnel hired on a per period basis, via extenal
companies.
Depreciation and amortization
Depreciation of property, plant and equipment and amortization of
intangibles are as follows:
2011 2012 2013
Depreciation of property, plant and
equipment 617 678 632
Amortization of internal-use software 55 45 39
Amortization of other intangible assets 559 458 432
Amortization of development costs 169 217 246
1,400 1,398 1,349
Depreciation of property, plant and equipment is primarily included in
cost of sales. Amortization of the categories of other intangible assets are
reported in selling expenses for brand names and customer relationships
and are reported in cost of sales for technology based and other intangible
assets. Amortization (including impairment) of development cost is
included in research and development expenses.
Shipping and handling
Shipping and handling costs are included in cost of sales and selling
expenses.
Advertising and promotion
Advertising and promotion costs are included in selling expenses.