Philips 2013 Annual Report Download - page 227
Download and view the complete annual report
Please find page 227 of the 2013 Philips annual report below. You can navigate through the pages in the report by either clicking on the pages listed below, or by using the keyword search tool below to find specific information within the annual report.-
 1
1 -
2
-
3
-
4
-
5
-
6
-
7
-
8
-
9
-
10
-
11
-
12
-
13
-
14
-
15
-
16
-
17
-
18
-
19
-
20
-
21
-
22
-
23
-
24
-
25
-
26
-
27
-
28
-
29
-
30
-
31
-
32
-
33
-
34
-
35
-
36
-
37
-
38
-
39
-
40
-
41
-
42
-
43
-
44
-
45
-
46
-
47
-
48
-
49
-
50
-
51
-
52
-
53
-
54
-
55
-
56
-
57
-
58
-
59
-
60
-
61
-
62
-
63
-
64
-
65
-
66
-
67
-
68
-
69
-
70
-
71
-
72
-
73
-
74
-
75
-
76
-
77
-
78
-
79
-
80
-
81
-
82
-
83
-
84
-
85
-
86
-
87
-
88
-
89
-
90
-
91
-
92
-
93
-
94
-
95
-
96
-
97
-
98
-
99
-
100
-
101
-
102
-
103
-
104
-
105
-
106
-
107
-
108
-
109
-
110
-
111
-
112
-
113
-
114
-
115
-
116
-
117
-
118
-
119
-
120
-
121
-
122
-
123
-
124
-
125
-
126
-
127
-
128
-
129
-
130
-
131
-
132
-
133
-
134
-
135
-
136
-
137
-
138
-
139
-
140
-
141
-
142
-
143
-
144
-
145
-
146
-
147
-
148
-
149
-
150
-
151
-
152
-
153
-
154
-
155
-
156
-
157
-
158
-
159
-
160
-
161
-
162
-
163
-
164
-
165
-
166
-
167
-
168
-
169
-
170
-
171
-
172
-
173
-
174
-
175
-
176
-
177
-
178
-
179
-
180
-
181
-
182
-
183
-
184
-
185
-
186
-
187
-
188
-
189
-
190
-
191
-
192
-
193
-
194
-
195
-
196
-
197
-
198
-
199
-
200
-
201
-
202
-
203
-
204
-
205
-
206
-
207
-
208
-
209
-
210
-
211
-
212
-
213
-
214
-
215
-
216
-
 217
217 -
 218
218 -
 219
219 -
 220
220 -
 221
221 -
 222
222 -
 223
223 -
 224
224 -
 225
225 -
 226
226 -
 227
227 -
 228
228 -
 229
229 -
 230
230 -
 231
231 -
 232
232 -
 233
233 -
 234
234 -
 235
235 -
 236
236 -
 237
237 -
238
-
239
-
240
-
241
-
242
-
243
-
244
-
245
-
246
-
247
-
248
-
249
-
250
 |
 |

14 Reconciliation of non-GAAP information 14 - 14
Annual Report 2013 227
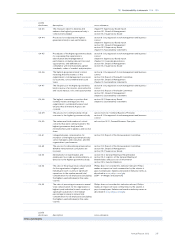
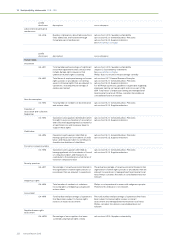
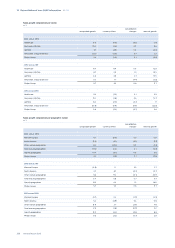
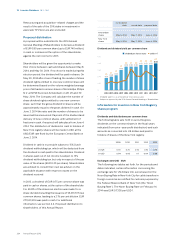
Composition of net debt to group equity
2011 2012 2013
Long-term debt 3,278 3,725 3,309
Short-term debt 582 809 592
Total debt 3,860 4,534 3,901
Cash and cash equivalents 3,147 3,834 2,465
Net debt (cash)1) 713 700 1,436
Shareholders’ equity 12,328 11,151 11,214
Non-controlling interests 34 34 13
Group equity 12,362 11,185 11,227
Net debt and group equity 13,075 11,885 12,663
Net debt divided by net debt and group equity (in %) 5 6 11
Group equity divided by net debt and group equity (in %) 95 94 89
1) Total debt less cash and cash equivalents.
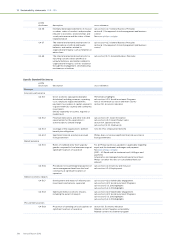
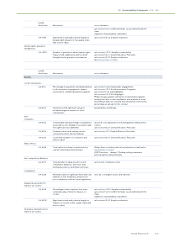
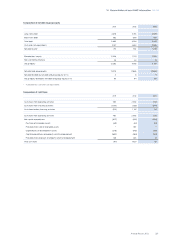
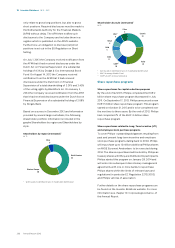
Composition of cash flows
2011 2012 2013
Cash flows from operating activities 760 2,082 1,138
Cash flows from investing activities (1,275) (925) (997)
Cash flows before financing activities (515) 1,157 141
Cash flows from operating activities 760 2,082 1,138
Net capital expenditures: (857) (455) (966)
Purchase of intangible assets (69) (34) (49)
Proceeds from sale of intangible assets − 160 −
Expenditures on development assets (276) (345) (357)
Capital expenditures on property, plant and equipment (640) (661) (587)
Proceeds from disposals of property, plant and equipment 128 425 27
Free cash flows (97) 1,627 172