Philips 2013 Annual Report Download - page 191
Download and view the complete annual report
Please find page 191 of the 2013 Philips annual report below. You can navigate through the pages in the report by either clicking on the pages listed below, or by using the keyword search tool below to find specific information within the annual report.-
 1
1 -
2
-
3
-
4
-
5
-
6
-
7
-
8
-
9
-
10
-
11
-
12
-
13
-
14
-
15
-
16
-
17
-
18
-
19
-
20
-
21
-
22
-
23
-
24
-
25
-
26
-
27
-
28
-
29
-
30
-
31
-
32
-
33
-
34
-
35
-
36
-
37
-
38
-
39
-
40
-
41
-
42
-
43
-
44
-
45
-
46
-
47
-
48
-
49
-
50
-
51
-
52
-
53
-
54
-
55
-
56
-
57
-
58
-
59
-
60
-
61
-
62
-
63
-
64
-
65
-
66
-
67
-
68
-
69
-
70
-
71
-
72
-
73
-
74
-
75
-
76
-
77
-
78
-
79
-
80
-
81
-
82
-
83
-
84
-
85
-
86
-
87
-
88
-
89
-
90
-
91
-
92
-
93
-
94
-
95
-
96
-
97
-
98
-
99
-
100
-
101
-
102
-
103
-
104
-
105
-
106
-
107
-
108
-
109
-
110
-
111
-
112
-
113
-
114
-
115
-
116
-
117
-
118
-
119
-
120
-
121
-
122
-
123
-
124
-
125
-
126
-
127
-
128
-
129
-
130
-
131
-
132
-
133
-
134
-
135
-
136
-
137
-
138
-
139
-
140
-
141
-
142
-
143
-
144
-
145
-
146
-
147
-
148
-
149
-
150
-
151
-
152
-
153
-
154
-
155
-
156
-
157
-
158
-
159
-
160
-
161
-
162
-
163
-
164
-
165
-
166
-
167
-
168
-
169
-
170
-
171
-
172
-
173
-
174
-
175
-
176
-
177
-
178
-
179
-
180
-
 181
181 -
 182
182 -
 183
183 -
 184
184 -
 185
185 -
 186
186 -
 187
187 -
 188
188 -
 189
189 -
 190
190 -
 191
191 -
 192
192 -
 193
193 -
 194
194 -
 195
195 -
 196
196 -
 197
197 -
 198
198 -
 199
199 -
 200
200 -
 201
201 -
202
-
203
-
204
-
205
-
206
-
207
-
208
-
209
-
210
-
211
-
212
-
213
-
214
-
215
-
216
-
217
-
218
-
219
-
220
-
221
-
222
-
223
-
224
-
225
-
226
-
227
-
228
-
229
-
230
-
231
-
232
-
233
-
234
-
235
-
236
-
237
-
238
-
239
-
240
-
241
-
242
-
243
-
244
-
245
-
246
-
247
-
248
-
249
-
250
 |
 |

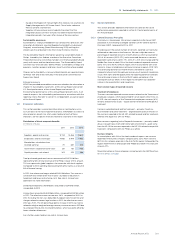
12 Company financial statements 12.1 - 12.1
Annual Report 2013 191
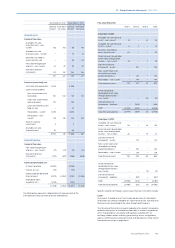
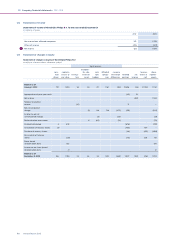
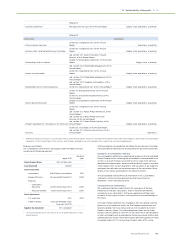
12.1 Balance sheets before appropriation of results
Balance sheets of Koninklijke Philips N.V. as of December 31
in millions of euros
2012 2013
Assets
Non-current assets:
Property, plant and equipment 2 18
Intangible assets
A9 55
Financial fixed assets
B16,597 19,535
Non-current receivables 49 32
Deferred tax assets 212 161
Other non-current financial assets
C325 283
17,194 20,084
Current assets:
Receivables
D7,988 7,500
Assets classified as held for sale − 45
Cash and cash equivalents 2,879 1,282
10,867 8,827
28,061 28,911
Liabilities and shareholders’ equity
Shareholders’ equity:
E
Preference shares, par value EUR 0.20 per share:
- Authorized: 2,000,000,000 shares (2012: 2,000,000,000 shares)
- Issued: none
Common shares, par value EUR 0.20 per share:
- Authorized: 2,000,000,000 shares (2012: 2,000,000,000 shares)
- Issued and fully paid: 937,845,789 shares (2012: 957,132,962 shares) 191 188
Capital in excess of par value 1,304 1,796
Legal reserve: revaluation 54 23
Legal reserve: available-for-sale financial assets 54 55
Legal reserve: cash flow hedges 20 24
Legal reserve: affiliated companies 1,161 1,319
Legal reserve: currency translation dierences (93) (569)
Retained earnings 9,598 7,927
Net income 1)
H(35) 1,169
Treasury shares, at cost: 24,508,022 shares (2012: 42,541,687 shares) (1,103) (718)
11,151 11,214
Non-current liabilities:
Long-term debt
F3,539 3,158
Long-term provisions 10 16
Deferred tax liabilities 19 15
Other non-current liabilities 139 161
3,707 3,350
Current liabilities:
Short-term debt
F11,742 13,645
Other current liabilities
G1,461 702
13,203 14,347
Contractual obligations and contingent liabilities not appearing in the balance sheet
J
28,061 28,911
1) Prepared before appropriation of results