Philips 2013 Annual Report Download - page 40
Download and view the complete annual report
Please find page 40 of the 2013 Philips annual report below. You can navigate through the pages in the report by either clicking on the pages listed below, or by using the keyword search tool below to find specific information within the annual report.-
 1
1 -
2
-
3
-
4
-
5
-
6
-
7
-
8
-
9
-
10
-
11
-
12
-
13
-
14
-
15
-
16
-
17
-
18
-
19
-
20
-
21
-
22
-
23
-
24
-
25
-
26
-
27
-
28
-
29
-
 30
30 -
 31
31 -
 32
32 -
 33
33 -
 34
34 -
 35
35 -
 36
36 -
 37
37 -
 38
38 -
 39
39 -
 40
40 -
 41
41 -
 42
42 -
 43
43 -
 44
44 -
 45
45 -
 46
46 -
 47
47 -
 48
48 -
 49
49 -
 50
50 -
51
-
52
-
53
-
54
-
55
-
56
-
57
-
58
-
59
-
60
-
61
-
62
-
63
-
64
-
65
-
66
-
67
-
68
-
69
-
70
-
71
-
72
-
73
-
74
-
75
-
76
-
77
-
78
-
79
-
80
-
81
-
82
-
83
-
84
-
85
-
86
-
87
-
88
-
89
-
90
-
91
-
92
-
93
-
94
-
95
-
96
-
97
-
98
-
99
-
100
-
101
-
102
-
103
-
104
-
105
-
106
-
107
-
108
-
109
-
110
-
111
-
112
-
113
-
114
-
115
-
116
-
117
-
118
-
119
-
120
-
121
-
122
-
123
-
124
-
125
-
126
-
127
-
128
-
129
-
130
-
131
-
132
-
133
-
134
-
135
-
136
-
137
-
138
-
139
-
140
-
141
-
142
-
143
-
144
-
145
-
146
-
147
-
148
-
149
-
150
-
151
-
152
-
153
-
154
-
155
-
156
-
157
-
158
-
159
-
160
-
161
-
162
-
163
-
164
-
165
-
166
-
167
-
168
-
169
-
170
-
171
-
172
-
173
-
174
-
175
-
176
-
177
-
178
-
179
-
180
-
181
-
182
-
183
-
184
-
185
-
186
-
187
-
188
-
189
-
190
-
191
-
192
-
193
-
194
-
195
-
196
-
197
-
198
-
199
-
200
-
201
-
202
-
203
-
204
-
205
-
206
-
207
-
208
-
209
-
210
-
211
-
212
-
213
-
214
-
215
-
216
-
217
-
218
-
219
-
220
-
221
-
222
-
223
-
224
-
225
-
226
-
227
-
228
-
229
-
230
-
231
-
232
-
233
-
234
-
235
-
236
-
237
-
238
-
239
-
240
-
241
-
242
-
243
-
244
-
245
-
246
-
247
-
248
-
249
-
250
 |
 |

4 Group performance 4.1.2 - 4.1.2
40 Annual Report 2013
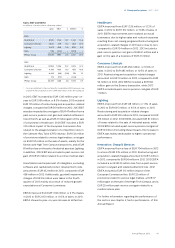
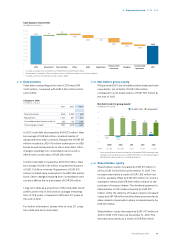
Sales growth composition 2013 versus 2012
in %
compara-
ble growth
currency
eects
consolida-
tion
changes
nominal
growth
Healthcare 0.8 (4.6) (0.3) (4.1)
Consumer
Lifestyle 10.0 (3.4) 0.0 6.6
Lighting 3.2 (3.5) 0.0 (0.3)
IG&S1) (2.0) (0.5) 5.7 3.2
Philips Group 3.3 (3.9) 0.1 (0.5)
1) Innovation, Group & Services
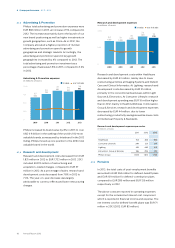
Group sales amounted to EUR 23,329 million in 2013,
which represents a 1% nominal decline compared to
2012.
Adjusting for a 4% negative currency eect comparable
sales were 3% above 2012. Comparable sales were up
10% at Consumer Lifestyle, while Lighting was 3%
higher and Healthcare 1% higher than the previous year.
Healthcare sales amounted to EUR 9,575 million, which
was EUR 408 million lower than in 2012, but 1% higher
on a comparable basis. Higher comparable sales were
driven by mid-single-digit growth at Customer
Services, while Home Healthcare Solutions and Patient
Care & Clinical Informatics recorded low-single-digit
growth. This was partly oset by a mid-single-digit
decline at Imaging Systems. Increases in growth
geographies were tempered by a decline in North
America and Western Europe.
Consumer Lifestyle reported sales of EUR 4,605 million,
which was EUR 286 million higher than in 2012, or 10%
higher on a comparable basis. We achieved double-
digit growth at Domestic Appliances and high-single-
digit growth at Health & Wellness and Personal Care.
Lighting sales amounted to EUR 8,413 million, which
was EUR 29 million lower than in 2012, but 3% higher on
a comparable basis. Growth was largely driven by
double-digit growth at Automotive and Lumileds and
low-single-digit growth at Light Sources & Electronics.
This was tempered by a low-single-digit decline at
Consumer Luminaires. while Professional Lighting
Solutions was flat year-on-year.
IG&S reported sales of EUR 736 million, which was EUR
23 million higher than in 2012, due to higher royalty
income.
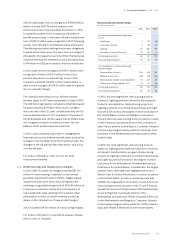
4.1.2 Earnings
In 2013, Philips’ gross margin was EUR 9,688 million, or
41.5% of sales, compared to EUR 8,991 million, or 38.3%
of sales, in 2012. Gross margin in 2013 included EUR 52
million of restructuring and acquisition-related charges,
whereas 2012 included EUR 289 million of restructuring
and acquisition-related charges. Higher gross margin
percentages were seen in all sectors.
Selling expenses decreased from EUR 5,334 million in
2012 to EUR 5,075 million in 2013. 2013 included EUR 45
million of restructuring and acquisition-related charges,
compared to EUR 184 million of restructuring charges in
2012. The year-on-year decrease was mainly
attributable to lower restructuring activities and
overhead reductions in our commercial organizations.
In relation to sales, selling expenses decreased from
22.7% to 21.8%. Selling expenses as a percentage of
sales were lower in all sectors.
General and administrative expenses amounted to EUR
949 million in 2013, compared to EUR 845 million in
2012. As a percentage of sales, costs increased from
3.6% in 2012 to 4.1%. 2013 included EUR 5 million of
restructuring and acquisition related-charges,
compared to EUR 31 million in 2012. The 2012 figure
included a EUR 25 million past-service pension cost
gain from a change in a medical retiree plan, while 2013
included a pension settlement loss of EUR 31 million.
Research and development costs decreased from EUR
1,831 million in 2012 to EUR 1,733 million in 2013.
Research and development costs in 2013 included EUR
15 million of restructuring and acquisition-related
charges, compared to EUR 57 million in 2012. The year-
on-year decrease was largely attributable to lower
restructuring charges and currency eects. As a
percentage of sales, research and development costs
decreased from 7.8% in 2012 to 7.4% in 2013.
The overview below shows sales, EBIT and EBITA
according to the 2013 sector classifications.