Philips 2013 Annual Report Download - page 64
Download and view the complete annual report
Please find page 64 of the 2013 Philips annual report below. You can navigate through the pages in the report by either clicking on the pages listed below, or by using the keyword search tool below to find specific information within the annual report.-
 1
1 -
2
-
3
-
4
-
5
-
6
-
7
-
8
-
9
-
10
-
11
-
12
-
13
-
14
-
15
-
16
-
17
-
18
-
19
-
20
-
21
-
22
-
23
-
24
-
25
-
26
-
27
-
28
-
29
-
30
-
31
-
32
-
33
-
34
-
35
-
36
-
37
-
38
-
39
-
40
-
41
-
42
-
43
-
44
-
45
-
46
-
47
-
48
-
49
-
50
-
51
-
52
-
53
-
 54
54 -
 55
55 -
 56
56 -
 57
57 -
 58
58 -
 59
59 -
 60
60 -
 61
61 -
 62
62 -
 63
63 -
 64
64 -
 65
65 -
 66
66 -
 67
67 -
 68
68 -
 69
69 -
 70
70 -
 71
71 -
 72
72 -
 73
73 -
 74
74 -
75
-
76
-
77
-
78
-
79
-
80
-
81
-
82
-
83
-
84
-
85
-
86
-
87
-
88
-
89
-
90
-
91
-
92
-
93
-
94
-
95
-
96
-
97
-
98
-
99
-
100
-
101
-
102
-
103
-
104
-
105
-
106
-
107
-
108
-
109
-
110
-
111
-
112
-
113
-
114
-
115
-
116
-
117
-
118
-
119
-
120
-
121
-
122
-
123
-
124
-
125
-
126
-
127
-
128
-
129
-
130
-
131
-
132
-
133
-
134
-
135
-
136
-
137
-
138
-
139
-
140
-
141
-
142
-
143
-
144
-
145
-
146
-
147
-
148
-
149
-
150
-
151
-
152
-
153
-
154
-
155
-
156
-
157
-
158
-
159
-
160
-
161
-
162
-
163
-
164
-
165
-
166
-
167
-
168
-
169
-
170
-
171
-
172
-
173
-
174
-
175
-
176
-
177
-
178
-
179
-
180
-
181
-
182
-
183
-
184
-
185
-
186
-
187
-
188
-
189
-
190
-
191
-
192
-
193
-
194
-
195
-
196
-
197
-
198
-
199
-
200
-
201
-
202
-
203
-
204
-
205
-
206
-
207
-
208
-
209
-
210
-
211
-
212
-
213
-
214
-
215
-
216
-
217
-
218
-
219
-
220
-
221
-
222
-
223
-
224
-
225
-
226
-
227
-
228
-
229
-
230
-
231
-
232
-
233
-
234
-
235
-
236
-
237
-
238
-
239
-
240
-
241
-
242
-
243
-
244
-
245
-
246
-
247
-
248
-
249
-
250
 |
 |
4 Group performance 4.3.1 - 4.3.2
64 Annual Report 2013
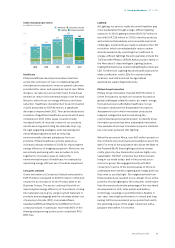
Energy efficiency of products
Energy efficiency is a key Green Focal Area for our
Green Products. About 97% of the energy consumed
during the use phase of our products is attributable to
Lighting products, according to our analysis. The
remaining 3% is split over Consumer Lifestyle and
Healthcare. Therefore, we focus on the energy
efficiency of our Lighting products in the calculation.
The annual energy consumption per product category
is calculated by multiplying the power consumption of
a product by the average annual operating hours and
the annual pieces sold and then dividing the light
output (lumens) by the energy consumed (watts). The
average energy efficiency of our total product portfolio
improved some 2% in 2013 (19% compared to 2009).
In 2013 LED sales continued to advance well, but
demand for conventional lighting remained fairly stable
due to the challenging economic environment. Since
the number of traditional lamps sold is significantly
higher than LEDs, the energy efficiency improvement of
the total Lighting portfolio in 2013 was limited. As the
traditional incandescent lamp will be banned in more
countries, we expect the energy efficiency
improvement to advance in the coming years. Our
target for 2015 is a 50% improvement compared to the
2009 baseline. In this target setting, assumptions were
made on the speed of the regulatory developments in
this area, which stayed behind expectations. Therefore,
in 2015 the target of 50% improvement will probably
not yet be achieved. Further details on this parameter
and the methodology can be found in the document
‘Energy efficiency of Philips products’ at
www.philips.com/sustainability.
Circular economy
For a sustainable world, the transition from a linear to a
circular economy is a necessary boundary condition. A
circular economy aims to decouple economic growth
from the use of natural resources and ecosystems by
using those resources more eectively. It is a driver for
innovation in the areas of material-, component- and
product reuse, as well as new business models such as
solutions and services. In a circular economy, the more
eective (re)use of materials enables to create more
value, both by cost savings and by developing new
markets or growing existing ones.
In 2013, Philips started its circular economy approach.
Key characteristics are customer access over
ownership (pay for performance e.g. pay per lux or pay
per scan), business model innovations (from
transactions to relationships via service and solution
models), reverse cycles (including partners outside
current value chains e.g. upstream-downstream
integration and co-creation) and logistics, innovations
for material-, component-, and product reuse, products
designed for disassembly and serviceability. In 2013,
Philips became a global partner of the Ellen McArthur
Foundation, the leading organization on the concept of
circular economy.
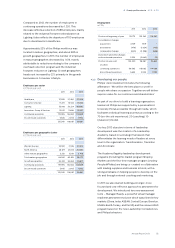
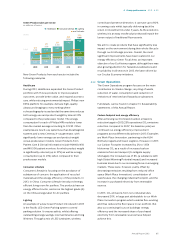
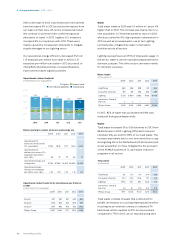
Closing the material loop
In 2013 we restated the 2009 baseline for global
collection and recycling amounts at around 22,500
tonnes (excluding TV and AVM&A), based on the data
retrieved from the WEEE collection schemes and from
our own recycling and refurbishment services (mainly
Healthcare). The amount of collection and recycling for
2012 (reported in 2013) was calculated at 31,000
tonnes, excluding AVM&A (which was calculated at
9,000 tonnes). A small improvement compared to the
amount for 2011 due to an increase in recycled products
in Healthcare.
Recycled materials
We calculated the amount of recycled materials in our
products in 2013 at some 14,000 tonnes (2012: 15,000
tonnes), by focusing on the material streams plastics,
aluminum, refurbished products, and spare parts
harvesting depending on the relevance in each sector.
Our target is to double the global collection and
recycling and the amount of recycled materials in our
products by 2015 compared to 2009. Further details on
this parameter and the methodology can be found in
the document ‘Closing the material loop’ at
www.philips.com/sustainability.
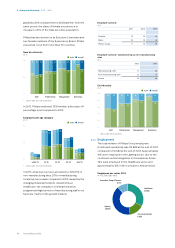
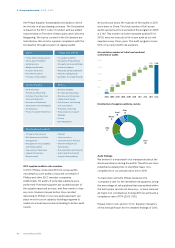
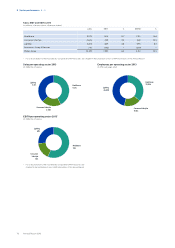
4.3.2 Green Product sales
Green Products oer a significant environmental
improvement in one or more Green Focal Areas: Energy
efficiency, Packaging, Hazardous substances, Weight,
Recycling and disposal and Lifetime reliability. Sales
from Green Products increased from EUR 11.0 billion in
2012 to EUR 11.8 billion in 2013, or 51% of sales, thereby
reaching the target of 50% we set ourselves for 2015.
All sectors contributed to the growth in Green Product
sales, but Consumer Lifestyle achieved the highest
Green Product nominal sales growth, followed by
Healthcare and Lighting. The exclusion of AVM&A had a
10% positive impact in 2013 on the Green Product sales
percentage of Consumer Lifestyle (2013: 49%).