Philips 2013 Annual Report Download - page 80
Download and view the complete annual report
Please find page 80 of the 2013 Philips annual report below. You can navigate through the pages in the report by either clicking on the pages listed below, or by using the keyword search tool below to find specific information within the annual report.-
 1
1 -
2
-
3
-
4
-
5
-
6
-
7
-
8
-
9
-
10
-
11
-
12
-
13
-
14
-
15
-
16
-
17
-
18
-
19
-
20
-
21
-
22
-
23
-
24
-
25
-
26
-
27
-
28
-
29
-
30
-
31
-
32
-
33
-
34
-
35
-
36
-
37
-
38
-
39
-
40
-
41
-
42
-
43
-
44
-
45
-
46
-
47
-
48
-
49
-
50
-
51
-
52
-
53
-
54
-
55
-
56
-
57
-
58
-
59
-
60
-
61
-
62
-
63
-
64
-
65
-
66
-
67
-
68
-
69
-
 70
70 -
 71
71 -
 72
72 -
 73
73 -
 74
74 -
 75
75 -
 76
76 -
 77
77 -
 78
78 -
 79
79 -
 80
80 -
 81
81 -
 82
82 -
 83
83 -
 84
84 -
 85
85 -
 86
86 -
 87
87 -
 88
88 -
 89
89 -
 90
90 -
91
-
92
-
93
-
94
-
95
-
96
-
97
-
98
-
99
-
100
-
101
-
102
-
103
-
104
-
105
-
106
-
107
-
108
-
109
-
110
-
111
-
112
-
113
-
114
-
115
-
116
-
117
-
118
-
119
-
120
-
121
-
122
-
123
-
124
-
125
-
126
-
127
-
128
-
129
-
130
-
131
-
132
-
133
-
134
-
135
-
136
-
137
-
138
-
139
-
140
-
141
-
142
-
143
-
144
-
145
-
146
-
147
-
148
-
149
-
150
-
151
-
152
-
153
-
154
-
155
-
156
-
157
-
158
-
159
-
160
-
161
-
162
-
163
-
164
-
165
-
166
-
167
-
168
-
169
-
170
-
171
-
172
-
173
-
174
-
175
-
176
-
177
-
178
-
179
-
180
-
181
-
182
-
183
-
184
-
185
-
186
-
187
-
188
-
189
-
190
-
191
-
192
-
193
-
194
-
195
-
196
-
197
-
198
-
199
-
200
-
201
-
202
-
203
-
204
-
205
-
206
-
207
-
208
-
209
-
210
-
211
-
212
-
213
-
214
-
215
-
216
-
217
-
218
-
219
-
220
-
221
-
222
-
223
-
224
-
225
-
226
-
227
-
228
-
229
-
230
-
231
-
232
-
233
-
234
-
235
-
236
-
237
-
238
-
239
-
240
-
241
-
242
-
243
-
244
-
245
-
246
-
247
-
248
-
249
-
250
 |
 |

5 Sector performance 5.2.4 - 5.2.6
80 Annual Report 2013
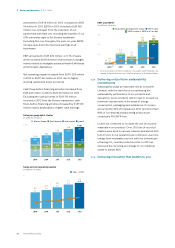
amounted to EUR 14 million in 2013, compared to EUR
56 million in 2012. EBITA in 2012 included a EUR 160
million one-time gain from the extension of our
partnership with Sara Lee, including the transfer of our
50% ownership right to the Senseo trademark.
Excluding this one-time gain, the year-on-year EBITA
increase was driven by improved earnings in all
businesses.
EBIT amounted to EUR 429 million, or 9.3% of sales,
which included EUR 54 million of amortization charges,
mainly related to intangible assets at Health & Wellness
and Domestic Appliances.
Net operating capital increased from EUR 1,205 million
in 2012 to EUR 1,261 million in 2013, due to higher
working capital and lower provisions.
Cash flows before financing activities increased from
EUR 422 million in 2012 to EUR 472 million in 2013.
Excluding the cash proceeds of EUR 170 million
received in 2012 from the Senseo transaction, cash
flows before financing activities increased by EUR 120
million mainly attributable to higher cash earnings.
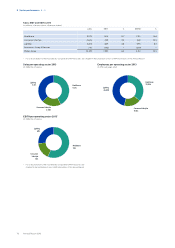
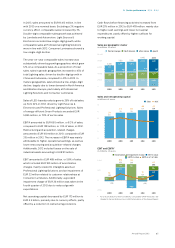
Sales per geographic cluster
in millions of euros
■-Western Europe_■-North America_■-other mature_■-growth
5,000
2,500
0
2009
1,200
516
142
1,067
2,925
2010
1,273
560
193
1,290
3,316
2011
1,323
688
228
1,532
3,771
2012
1,325
768
272
1,954
4,319
2013
1,350
769
299
2,187
4,605
Sales and net operating capital
in billions of euros ■-Sales----NOC
6
3
0
0.7
2.9
2009
0.9
3.3
2010
0.9
3.8
2011
1.2
4.3
2012
1.3
4.6
2013
EBIT and EBITA1)
in millions of euros
■-Amortization and impairment in value_■-EBIT in value
■
■-EBITA in value_--EBITA as a % of sales
600
400
200
0
16
14 30
1.0
2009
188
23
211
6.4
2010
109
44
153
4.1
2011
400
56
456
10.6
2012
429
54
483
10.5
2013
1) For a reconciliation to the most directly comparable GAAP measures, see
chapter 14, Reconciliation of non-GAAP information, of this Annual Report
5.2.5 Delivering on EcoVision sustainability
commitments
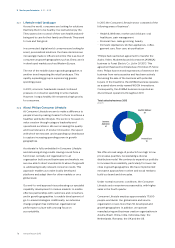
Sustainability plays an important role at Consumer
Lifestyle, with the main focus on optimizing the
sustainability performance of our products and
operations. Green products, which meet or exceed our
minimum requirements in the areas of energy
consumption, packaging and substances of concern,
accounted for 49% of total sales in 2013. And more than
80% of our shaving and grooming products are
completely PVC/BFR-free.
In 2013 we continued to increase the use of recycled
materials in our products. Over 330 tons of recycled
plastics were used in vacuum cleaners and almost 250
tons in irons. In our operations we continue to use more
energy from renewable sources, with the ultimate aim
of having CO2-neutral production sites. In 2013 we
improved the recycling percentage of our industrial
waste to almost 80%.
5.2.6 Delivering innovation that matters to you