Philips 2013 Annual Report Download - page 113
Download and view the complete annual report
Please find page 113 of the 2013 Philips annual report below. You can navigate through the pages in the report by either clicking on the pages listed below, or by using the keyword search tool below to find specific information within the annual report.-
 1
1 -
2
-
3
-
4
-
5
-
6
-
7
-
8
-
9
-
10
-
11
-
12
-
13
-
14
-
15
-
16
-
17
-
18
-
19
-
20
-
21
-
22
-
23
-
24
-
25
-
26
-
27
-
28
-
29
-
30
-
31
-
32
-
33
-
34
-
35
-
36
-
37
-
38
-
39
-
40
-
41
-
42
-
43
-
44
-
45
-
46
-
47
-
48
-
49
-
50
-
51
-
52
-
53
-
54
-
55
-
56
-
57
-
58
-
59
-
60
-
61
-
62
-
63
-
64
-
65
-
66
-
67
-
68
-
69
-
70
-
71
-
72
-
73
-
74
-
75
-
76
-
77
-
78
-
79
-
80
-
81
-
82
-
83
-
84
-
85
-
86
-
87
-
88
-
89
-
90
-
91
-
92
-
93
-
94
-
95
-
96
-
97
-
98
-
99
-
100
-
101
-
102
-
 103
103 -
 104
104 -
 105
105 -
 106
106 -
 107
107 -
 108
108 -
 109
109 -
 110
110 -
 111
111 -
 112
112 -
 113
113 -
 114
114 -
 115
115 -
 116
116 -
 117
117 -
 118
118 -
 119
119 -
 120
120 -
 121
121 -
 122
122 -
 123
123 -
124
-
125
-
126
-
127
-
128
-
129
-
130
-
131
-
132
-
133
-
134
-
135
-
136
-
137
-
138
-
139
-
140
-
141
-
142
-
143
-
144
-
145
-
146
-
147
-
148
-
149
-
150
-
151
-
152
-
153
-
154
-
155
-
156
-
157
-
158
-
159
-
160
-
161
-
162
-
163
-
164
-
165
-
166
-
167
-
168
-
169
-
170
-
171
-
172
-
173
-
174
-
175
-
176
-
177
-
178
-
179
-
180
-
181
-
182
-
183
-
184
-
185
-
186
-
187
-
188
-
189
-
190
-
191
-
192
-
193
-
194
-
195
-
196
-
197
-
198
-
199
-
200
-
201
-
202
-
203
-
204
-
205
-
206
-
207
-
208
-
209
-
210
-
211
-
212
-
213
-
214
-
215
-
216
-
217
-
218
-
219
-
220
-
221
-
222
-
223
-
224
-
225
-
226
-
227
-
228
-
229
-
230
-
231
-
232
-
233
-
234
-
235
-
236
-
237
-
238
-
239
-
240
-
241
-
242
-
243
-
244
-
245
-
246
-
247
-
248
-
249
-
250
 |
 |

9 Supervisory Board report 9.2.6 - 9.2.7
Annual Report 2013 113
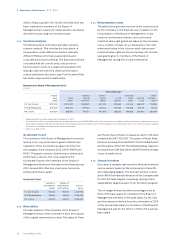
To support the performance culture, the Annual
Incentive plan is based on (financial) targets at ‘own
level’ and ‘group’ level results (line-of-sight). The 2013
realization is a reflection of above target performance
on EBITA, ROIC and Team Targets and a below target
realization on CSG, resulting in the pay-out as
presented in the table below.
Annual Incentive realization 2013 (pay-out in 2014)
in euros
realized annual
incentive
as a % of base
salary (2013)
F.A. van Houten 1,081,520 98.3%
R.H. Wirahadiraksa 497,745 73.7%
P.A.J. Nota 561,713 89.9%
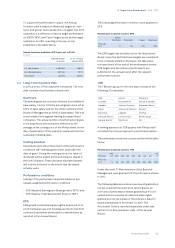
9.2.7 Long-Term Incentive Plan
In 2013 a new LTI Plan has been introduced. The new
plan consists of performance shares only.
Grant size
The annual grant size is set by reference to a multiple of
base salary. For the CEO the annual grant size is set at
120% of base salary and for the other members of the
Board of Management at 100% of base salary. This is at
a mid-market level against leading European listed
companies. The actual number of performance shares
to be awarded is determined by reference to the
average of the closing price of the Philips share on the
day of publication of the quarterly results and the four
subsequent dealing days.
Vesting schedule
Dependent upon the achievement of the performance
conditions cli-vesting applies three years after the
date of grant. During the vesting period, the value of
dividends will be added to the performance shares in
the form of shares. These dividend equivalent shares
will only be delivered to the extent that the award
actually vests.
Performance conditions
Vesting of the performance shares is based on two
equally weighted performance conditions:
• 50% Adjusted Earnings per Share growth (“EPS”) and
• 50% Relative Total Shareholder Return (“TSR”)
EPS
EPS growth is calculated applying the simple point-to-
point method at year end. Earnings are the income from
continued operations attributable to shareholders as
reported in the Annual Report.
The following performance incentive-zone applies for
EPS:
Performance incentive-zone for EPS
Below
threshold Threshold Target Maximum
Pay-out
in % 0 40 100 200
The EPS targets are annually set by the Supervisory
Board. Given the fact that these targets are considered
to be company sensitive disclosure will take place
retrospectively at the end of the performance period.
EPS targets and the achieved performance are
published in the annual report after the relevant
performance period.
TSR
The TSR peer group for the new plan consists of the
following 21 companies:
ABB Hitachi Panasonic
Covidien Honeywell Int. Procter & Gamble
Danaher Johnson Controls Schneider Electric
Eaton Johnson & Johnson Siemens
Electrolux Legrand Toshiba
Emerson Electric LG Electronics Smiths Group
General Electric Medtronic 3M
A ranking approach to TSR applies with Philips itself
excluded from the peer group to permit interpolation.
The performance incentive-zone is outlined in the table
below:
Performance incentive-zone for TSR
Position
≥14
-21 ≥13 ≥12 ≥11 ≥10 ≥9 ≥8 ≥7
≥6
-1
Pay-out
in % 0 60 60 100 120 140 160 180 200
Under the new LTI Plan members of the Board of
Management were granted 124,171 performance shares
in 2013.
The following tables provide an overview of granted but
not yet vested (locked up) stock option grants, an
overview of performance shares granted but not yet
vested and an overview of restricted share rights
granted but not yet released. The reference date for
board membership is December 31, 2013. The
Accelerate! Grant is reported separately under sub-
section 9.2.4, Remuneration costs, of this Annual
Report.