Philips 2013 Annual Report Download - page 174
Download and view the complete annual report
Please find page 174 of the 2013 Philips annual report below. You can navigate through the pages in the report by either clicking on the pages listed below, or by using the keyword search tool below to find specific information within the annual report.-
 1
1 -
2
-
3
-
4
-
5
-
6
-
7
-
8
-
9
-
10
-
11
-
12
-
13
-
14
-
15
-
16
-
17
-
18
-
19
-
20
-
21
-
22
-
23
-
24
-
25
-
26
-
27
-
28
-
29
-
30
-
31
-
32
-
33
-
34
-
35
-
36
-
37
-
38
-
39
-
40
-
41
-
42
-
43
-
44
-
45
-
46
-
47
-
48
-
49
-
50
-
51
-
52
-
53
-
54
-
55
-
56
-
57
-
58
-
59
-
60
-
61
-
62
-
63
-
64
-
65
-
66
-
67
-
68
-
69
-
70
-
71
-
72
-
73
-
74
-
75
-
76
-
77
-
78
-
79
-
80
-
81
-
82
-
83
-
84
-
85
-
86
-
87
-
88
-
89
-
90
-
91
-
92
-
93
-
94
-
95
-
96
-
97
-
98
-
99
-
100
-
101
-
102
-
103
-
104
-
105
-
106
-
107
-
108
-
109
-
110
-
111
-
112
-
113
-
114
-
115
-
116
-
117
-
118
-
119
-
120
-
121
-
122
-
123
-
124
-
125
-
126
-
127
-
128
-
129
-
130
-
131
-
132
-
133
-
134
-
135
-
136
-
137
-
138
-
139
-
140
-
141
-
142
-
143
-
144
-
145
-
146
-
147
-
148
-
149
-
150
-
151
-
152
-
153
-
154
-
155
-
156
-
157
-
158
-
159
-
160
-
161
-
162
-
163
-
 164
164 -
 165
165 -
 166
166 -
 167
167 -
 168
168 -
 169
169 -
 170
170 -
 171
171 -
 172
172 -
 173
173 -
 174
174 -
 175
175 -
 176
176 -
 177
177 -
 178
178 -
 179
179 -
 180
180 -
 181
181 -
 182
182 -
 183
183 -
 184
184 -
185
-
186
-
187
-
188
-
189
-
190
-
191
-
192
-
193
-
194
-
195
-
196
-
197
-
198
-
199
-
200
-
201
-
202
-
203
-
204
-
205
-
206
-
207
-
208
-
209
-
210
-
211
-
212
-
213
-
214
-
215
-
216
-
217
-
218
-
219
-
220
-
221
-
222
-
223
-
224
-
225
-
226
-
227
-
228
-
229
-
230
-
231
-
232
-
233
-
234
-
235
-
236
-
237
-
238
-
239
-
240
-
241
-
242
-
243
-
244
-
245
-
246
-
247
-
248
-
249
-
250
 |
 |

31 11 Group financial statements 11.9 - 11.9
174 Annual Report 2013
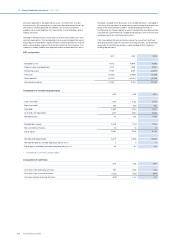
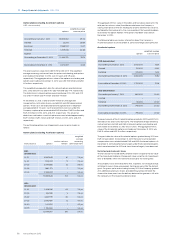
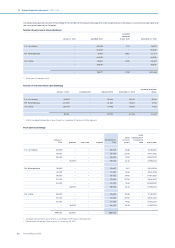
The weighted average assumptions used to calculate the defined benefit
obligations for retiree medical plans as of December 31 were as follows:
2012 2013
Discount rate 4.5% 4.8%
Compensation increase (where applicable) − −
Assumed healthcare cost trend rates at December 31:
2012 2013
Healthcare cost trend rate assumed for next year 7.5% 7.5%
Rate that the cost trend rate will gradually reach 5.2% 5.2%
Year of reaching the rate at which it is assumed to
remain 2019 2019
The average duration of the DBO of the retiree medical plans is 9 years
(2012: 8 years).
Investment policy in our largest pension plans
It must be acknowledged that trustees of the Philips pension plans are
responsible for and have full discretion over the investment strategy of the
plan assets.
The objective of the liability hedging portfolio of the Philips pension plan
in the Netherlands is to match part of the interest rate sensitivity of the
plan’s inflation-linked pension liabilities (based on a 2% inflation
assumption). The liability hedging portfolio is mainly invested in euro-
denominated government bonds, investment grade debt securities and
long-duration interest rate swaps. The size of the liability hedging
portfolio is targeted to be at least 64% of the fair value of the plan’s
inflation-linked pension liabilities. The objective of the return portfolio is
to maximize investment returns within well-specified risk constraints.
The Philips pension plan in the United Kingdom operates a fixed income
portfolio that aims to fully hedge the interest rate and inflation rate
sensitivities of the fair value of the plan’s pension liabilities. Part of the
portfolio is invested in a buy-in policy, in which an insurance company
guarantees all future benefit payments to the plan, thereby matching the
investment and longevity risks of the pension liabilities covered in the
buy-in policy.
The plan assets of the Philips pension plan in the United States are
invested in a well diversified portfolio. The interest rate sensitivity of the
fixed income portfolio is closely aligned to that of the plan’s pension
liabilities. Any contributions from the sponsoring company are used to
further increase the fixed income part of the assets. As part of the
investment strategy, any additional investment returns of the return
portfolio are used to further decrease the interest rate mismatch between
the plan assets and the pension liabilities.
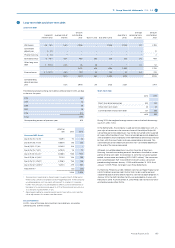
Cash flows and costs in 2014
Philips expects considerable cash outflows in relation to employee
benefits which are estimated to amount to EUR 626 million in 2014,
consisting of EUR 417 million employer contributions to defined benefit
pension plans, EUR 140 million employer contributions to defined
contribution pension plans, EUR 52 million expected cash outflows in
relation to unfunded pension plans and EUR 17 million in relation to
unfunded retiree medical plans. The employer contributions to defined
benefit pension plans are expected to amount to EUR 223 million for the
Netherlands and EUR 194 million for other countries. The Company
continues to fund a part of the existing deficit in the US pension plan in
2014, which amount is included in the amounts aforementioned. For the
funding of the deficit in the US plan the Group adheres to the minimum
funding requirements of the US Pension Protection Act. The UK plan is
currently in a surplus on a regulatory basis and does not require any
funding in 2014 other than the agreed administration cost.
The funding of the pension fund in the Netherlands for 2014 consists of a
fixed percentage of payroll which applies for a period of 5 years. The
additional contribution to the pension fund for the Netherlands is not
included in the above figures. For further details we refer to note 36,
Subsequent events. It is noted that the (majority of the) contribution will
need to be written o through Other comprehensive income due to the
asset ceiling restrictions in the pension plan in the Netherlands.
The service and administration cost for 2014 is expected to amount to EUR
256 million, consisting of EUR 255 million for defined-benefit pension
plans and EUR 1 million for defined-benefit retiree medical plans. The net
interest expense for 2014 is expected to amount to EUR 54 million,
consisting of EUR 43 million for defined-benefit pension plans and EUR 11
million for defined-benefit retiree medical plans. The cost for defined-
contribution pension plans in 2014 is expected to amount to EUR 140
million.
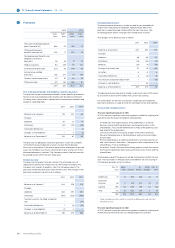
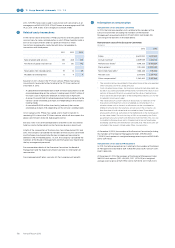
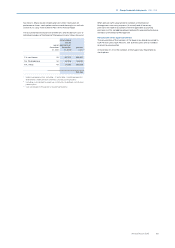
Sensitivity analysis
The table below illustrates the approximate impact on the defined-benefit
obligation if the Company were to change key assumptions. The DBO was
recalculated using a change in the assumptions of 1% which overall is
considered a reasonably possible change. The impact on the DBO
because of changes in discount rate is normally accompanied by
osetting movements in plan assets, especially when using matching
strategies.
Defined benefit obligation
2013
Pension
Netherlands
Pension
other
Retiree
medical
Increase
Discount rate (1%
movement) (1,708) (822) (12)
Wage increase (1%
movement) 165 28 −
Inflation (1% movement) 979 461 −
Longevity (see explanation) 355 232 7
Medical benefit level (1%
price increase) − − 12
Decrease
Discount rate (1%
movement) 2,158 962 16
Wage increase (1%
movement) (147) (26) −
Inflation (1% movement) (876) (418) −
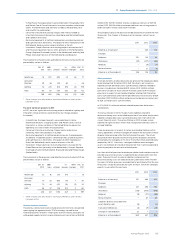
Longevity also impacts post-employment benefit liabilities. The above
sensitivity table illustrates the impact on the defined-benefit obligation of
a further 10% decrease in the assumed rates of mortality for the
Company’s major schemes. A 10% decrease in assumed mortality rates
equals improvement of life expectancy by 0.5 - 1 year.
Changes in assumed health care cost trend rates can have a significant
eect on the amounts reported for the retiree medical plans. A one
percentage-point increase in medical benefit level is therefore included in
above table as a likely scenario.
Philips Pension Fund in the Netherlands
In relation to the fraud in the Dutch real estate sector uncovered in 2007,
Philips and the Philips Pension Fund in the Netherlands have jointly and
amicably assessed any residual damages in 2013. In view of the new
pension agreement, which includes a new funding structure, eective as of
January 1, 2014, Philips decided to make a special cash contribution in
2013 to ensure that any potential financial issues from the past, including
this real estate fraud, were cleared. As a result of this special contribution
the real estate case has been closed.
31 Share-based compensation
The purpose of the share-based compensation plans is to align the
interests of management with those of shareholders by providing
incentives to improve the Company’s performance on a long-term basis,
thereby increasing shareholder value.
The Company has the following plans:
• options on its common shares;
• rights to receive common shares in the future based on a service
condition (restricted shares);
• rights to receive common shares in the future based on performance
and service conditions (performance shares).