Philips 2013 Annual Report Download - page 4
Download and view the complete annual report
Please find page 4 of the 2013 Philips annual report below. You can navigate through the pages in the report by either clicking on the pages listed below, or by using the keyword search tool below to find specific information within the annual report.-
 1
1 -
 2
2 -
 3
3 -
 4
4 -
 5
5 -
 6
6 -
 7
7 -
 8
8 -
 9
9 -
 10
10 -
 11
11 -
 12
12 -
 13
13 -
 14
14 -
 15
15 -
16
-
17
-
18
-
19
-
20
-
21
-
22
-
23
-
24
-
25
-
26
-
27
-
28
-
29
-
30
-
31
-
32
-
33
-
34
-
35
-
36
-
37
-
38
-
39
-
40
-
41
-
42
-
43
-
44
-
45
-
46
-
47
-
48
-
49
-
50
-
51
-
52
-
53
-
54
-
55
-
56
-
57
-
58
-
59
-
60
-
61
-
62
-
63
-
64
-
65
-
66
-
67
-
68
-
69
-
70
-
71
-
72
-
73
-
74
-
75
-
76
-
77
-
78
-
79
-
80
-
81
-
82
-
83
-
84
-
85
-
86
-
87
-
88
-
89
-
90
-
91
-
92
-
93
-
94
-
95
-
96
-
97
-
98
-
99
-
100
-
101
-
102
-
103
-
104
-
105
-
106
-
107
-
108
-
109
-
110
-
111
-
112
-
113
-
114
-
115
-
116
-
117
-
118
-
119
-
120
-
121
-
122
-
123
-
124
-
125
-
126
-
127
-
128
-
129
-
130
-
131
-
132
-
133
-
134
-
135
-
136
-
137
-
138
-
139
-
140
-
141
-
142
-
143
-
144
-
145
-
146
-
147
-
148
-
149
-
150
-
151
-
152
-
153
-
154
-
155
-
156
-
157
-
158
-
159
-
160
-
161
-
162
-
163
-
164
-
165
-
166
-
167
-
168
-
169
-
170
-
171
-
172
-
173
-
174
-
175
-
176
-
177
-
178
-
179
-
180
-
181
-
182
-
183
-
184
-
185
-
186
-
187
-
188
-
189
-
190
-
191
-
192
-
193
-
194
-
195
-
196
-
197
-
198
-
199
-
200
-
201
-
202
-
203
-
204
-
205
-
206
-
207
-
208
-
209
-
210
-
211
-
212
-
213
-
214
-
215
-
216
-
217
-
218
-
219
-
220
-
221
-
222
-
223
-
224
-
225
-
226
-
227
-
228
-
229
-
230
-
231
-
232
-
233
-
234
-
235
-
236
-
237
-
238
-
239
-
240
-
241
-
242
-
243
-
244
-
245
-
246
-
247
-
248
-
249
-
250
 |
 |

Performance highlights
4 Annual Report 2013
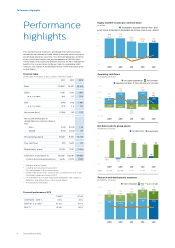
Performance
highlights
Prior-period financial statements and related information have been
restated for the treatment of Audio, Video, Multimedia and Accessories as
discontinued operations (see note 7, Discontinued operations and other
assets classified as held for sale) and the adoption of IAS 19R, which
mainly relates to accounting for pensions (see note 30, Post-employment
benefits). For a reconciliation to the most directly comparable GAAP
measures, see chapter 14, Reconciliation of non-GAAP information, of this
Annual Report.
Financial table
all amounts in millions of euros unless otherwise stated
2011 2012 2013
Sales 20,992 23,457 23,329
EBITA 1,435 1,106 2,451
as a % of sales 6.8 4.7 10.5
EBIT (479) 648 1,991
as a % of sales (2.3) 2.8 8.5
Net income (loss) (1,456) (30) 1,172
Net income attributable to
shareholders per common share in
euro:
- basic (1.53) (0.04) 1.28
- diluted (1.53) (0.04) 1.27
Net operating capital 10,382 9,316 10,238
Free cash flows (97) 1,627 172
Shareholders’ equity 12,328 11,151 11,214
Employees at December 31 125,240 118,087 116,681
of which discontinued operations 5,645 2,005 1,992
1) Mid-term financial targets
2) Including restructuring and acquisitions
3) Excluding Mergers & Acquisitions impact
4) Based on the results of 60 “pulse surveys” as there was no full-scope
Employee Engagement Survey in 2012
5) For a definition of of mature and growth geographies, see chapter 17,
Definitions and abbreviations, of this Annual Report
6) As measured by Interbrand
Financial performance 2013
Target1) Actual
CAGR 2012 - 2013 % 4-6% 4.5%
EBITA as % of sales2) 10-12% 10.5%
ROIC %3) 12-14% 15.3%
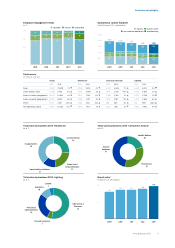
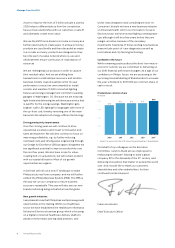
Equity and Net income per common share
in euros ■-shareholders’ equity per common share - basic
--Net income attributable to shareholders per common share in euro - diluted
20
15
10
5
0
(5)
0.26
15.72
2009
1.36
15.87
2010
(1.53)
13.31
2011
(0.04)
12.19
2012
1.27
12.28
2013
Operating cash flows
in millions of euros
■-net capital expenditures_■
■-free cash flows
■-operating cash flows_--free cash flows as a % of sales
3,000
2,000
1,000
0
(1,000)
(2,000)
985
(574)
411
2.3
2009
1,931
(696)
1,235
6.0
2010
760
(857)
(97)
(0.5)
2011
2,082
(455)
1,627
6.9
2012
1,138
(966)
172
0.7
2013
Net debt (cash) to group equity
in billions of euros ■-net debt (cash)--■-group equity
20
15
10
5
0
(5)
(0.1)
14.6
(1) : 101
2009
(1.2)
15.1
(8) : 108
2010
0.7
12.4
5 : 95
2011
0.7
11.2
6 : 94
2012
1.4
11.2
11 : 89
2013
ratio:
Research and development expenses
in millions of euros
■-Green Innovation_■
■-R&D_--as a % of sales
2,000
1,500
1,000
500
0
1,186
340
1,526
8.4
2009
1,094
392
1,486
7.3
2010
1,126
479
1,605
7.6
2011
1,262
569
1,831
7.8
2012
1,224
509
1,733
7.4
2013