Philips 2013 Annual Report Download - page 154
Download and view the complete annual report
Please find page 154 of the 2013 Philips annual report below. You can navigate through the pages in the report by either clicking on the pages listed below, or by using the keyword search tool below to find specific information within the annual report.-
 1
1 -
2
-
3
-
4
-
5
-
6
-
7
-
8
-
9
-
10
-
11
-
12
-
13
-
14
-
15
-
16
-
17
-
18
-
19
-
20
-
21
-
22
-
23
-
24
-
25
-
26
-
27
-
28
-
29
-
30
-
31
-
32
-
33
-
34
-
35
-
36
-
37
-
38
-
39
-
40
-
41
-
42
-
43
-
44
-
45
-
46
-
47
-
48
-
49
-
50
-
51
-
52
-
53
-
54
-
55
-
56
-
57
-
58
-
59
-
60
-
61
-
62
-
63
-
64
-
65
-
66
-
67
-
68
-
69
-
70
-
71
-
72
-
73
-
74
-
75
-
76
-
77
-
78
-
79
-
80
-
81
-
82
-
83
-
84
-
85
-
86
-
87
-
88
-
89
-
90
-
91
-
92
-
93
-
94
-
95
-
96
-
97
-
98
-
99
-
100
-
101
-
102
-
103
-
104
-
105
-
106
-
107
-
108
-
109
-
110
-
111
-
112
-
113
-
114
-
115
-
116
-
117
-
118
-
119
-
120
-
121
-
122
-
123
-
124
-
125
-
126
-
127
-
128
-
129
-
130
-
131
-
132
-
133
-
134
-
135
-
136
-
137
-
138
-
139
-
140
-
141
-
142
-
143
-
 144
144 -
 145
145 -
 146
146 -
 147
147 -
 148
148 -
 149
149 -
 150
150 -
 151
151 -
 152
152 -
 153
153 -
 154
154 -
 155
155 -
 156
156 -
 157
157 -
 158
158 -
 159
159 -
 160
160 -
 161
161 -
 162
162 -
 163
163 -
 164
164 -
165
-
166
-
167
-
168
-
169
-
170
-
171
-
172
-
173
-
174
-
175
-
176
-
177
-
178
-
179
-
180
-
181
-
182
-
183
-
184
-
185
-
186
-
187
-
188
-
189
-
190
-
191
-
192
-
193
-
194
-
195
-
196
-
197
-
198
-
199
-
200
-
201
-
202
-
203
-
204
-
205
-
206
-
207
-
208
-
209
-
210
-
211
-
212
-
213
-
214
-
215
-
216
-
217
-
218
-
219
-
220
-
221
-
222
-
223
-
224
-
225
-
226
-
227
-
228
-
229
-
230
-
231
-
232
-
233
-
234
-
235
-
236
-
237
-
238
-
239
-
240
-
241
-
242
-
243
-
244
-
245
-
246
-
247
-
248
-
249
-
250
 |
 |

7 11 Group financial statements 11.9 - 11.9
154 Annual Report 2013
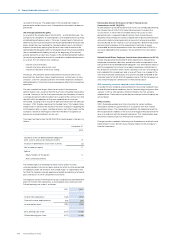
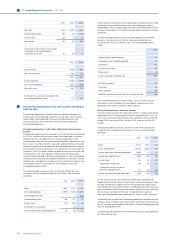
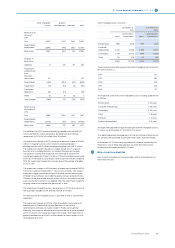
2011 2012 2013
Net sales 408 2,534 2,180
Income before taxes 86 (7) (243)
Income taxes (27) 2 12
Net income 59 (5) (231)
Total share in net income of associates
recognized in the Consolidated
statements of income 18 (5) 5
2012 2013
Current assets 1,635 1,368
Non-current assets 485 412
2,120 1,780
Current liabilities (1,544) (1,327)
Non-current liabilities (186) (278)
Net asset value 390 175
Investments in associates included in the
Consolidated balance sheet 177 161
7Discontinued operations and other assets classified as
held for sale
Discontinued operations included in the Consolidated statements of
income and the Consolidated statements of cash flows consists of the
Audio, Video, Multimedia and Accessories (AVM&A) business, the
Television business and certain divestments formerly reported as
discontinued operations.
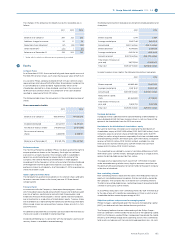
Discontinued operations: Audio, Video, Multimedia and Accessories
business
Following the agreement with Funai Electric Co. Ltd which was announced
in Q1 2013, the results of the Audio, Video, Multimedia and Accessories
(AVM&A) business are reported as discontinued operations in the
Consolidated statements of income and Consolidated statements of cash
flows. Assets classified as held for sale and Liabilities directly associated
with assets held for sale are reported in the Consolidated balance sheet as
of the moment of the announcement. This agreement was terminated on
October 25, 2013. Since then, Philips has been actively discussing the sale
of the business with various parties. Therefore the AVM&A business
continues to be reported as discontinued operations in the Consolidated
statements of income and Consolidated statements of cash flows with the
related assets and liabilities included as Assets classified as held for sale
and Liabilities directly associated with assets held for sale in the
Consolidated balance sheet.
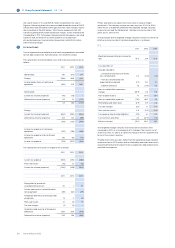
The following table summarizes the results of the AVM&A business
included in the Consolidated statements of income as discontinued
operations.
2011 2012 2013
Sales 1,587 1,331 1,117
Costs and expenses (1,499) (1,210) (1,067)
Disentanglement costs − − (44)
Income before taxes 88 121 6
Income taxes (10) (40) (3)
Investments in associates − (3) −
Results from discontinued operations 78 78 3
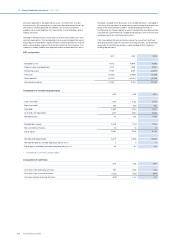
At the moment of divestment the related balance sheet positions will be
transferred, the associated currency translation dierences, part of
Shareholders’ equity, will be recognized in the Consolidated statement of
income. At December 31, 2013, the estimated release amounts to a EUR 3
million loss.
The following table presents the assets and liabilities of the AVM&A
business, classified as Assets held for sale and Liabilities directly
associated with the assets held for sale in the Consolidated balance
sheets.
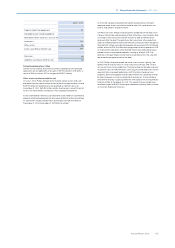
2013
Property, plant and equipment 17
Intangible assets including goodwill 32
Inventories 130
Accounts receivable 212
Other assets 9
Assets classified as held for sale 400
Accounts payable 217
Provisions 33
Other liabilities 98
Liabilities directly associated with assets held for sale 348
Non-transferrable balance sheet positions, such as certain accounts
receivable, accounts payable, accrued liabilities and provisions are
reported on the respective balance sheet captions.
Discontinued operations: Television business
As announced in Q1 2012, the Television business’s strategic partnership
agreement with TPV Technology Limited was signed on April 1, 2012. In
2013, the discontinued Television business reported a net loss of EUR 6
million (2012: a net loss of EUR 31 million; 2011: a net loss of EUR 515
million).
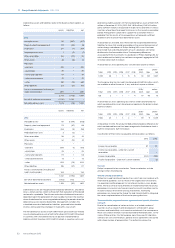
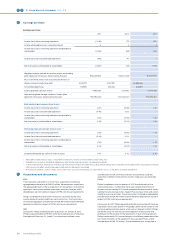
The following table summarizes the results of the Television business
included in the Consolidated statements of income as discontinued
operations.
2011 2012 2013
Sales 2,702 563 (3)
Costs and expenses (2,913) (622) (3)
loss on sale of discontinued operations (380) 5 4
Income (loss) before taxes (591) (54) (2)
Income taxes 76 23 (4)
Operational income tax 49 28 (2)
Income tax on loss on sale of
discontinued operations 27 (5) (2)
Results from discontinued operations (515) (31) (6)
In 2011, the loss on the sale of the Television business amounted to
approximately EUR 380 million, which mainly comprised of present value
of initial contributions made to the TV venture (EUR 183 million), total
disentanglement costs (EUR 81 million), contributed assets which were not
fully recovered (EUR 66 million) and various smaller other items, oset by
the revenue associated with the sale, including the fair value of a
contingent consideration and a retained 30% interest in the TV venture.
In addition to the contributions that were agreed and recognized as loss on
onerous contract, Philips made commitments to provide further financing
to the TV venture for more details see note 25, Contractual obligations and
note 36, Subsequent events.
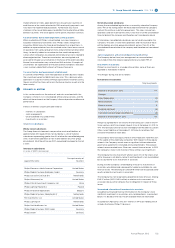
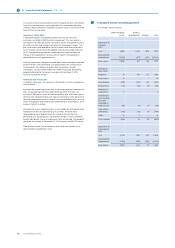
The following table presents the in 2012 divested assets and liabilities of
the Television business.