Philips 2013 Annual Report Download - page 84
Download and view the complete annual report
Please find page 84 of the 2013 Philips annual report below. You can navigate through the pages in the report by either clicking on the pages listed below, or by using the keyword search tool below to find specific information within the annual report.-
 1
1 -
2
-
3
-
4
-
5
-
6
-
7
-
8
-
9
-
10
-
11
-
12
-
13
-
14
-
15
-
16
-
17
-
18
-
19
-
20
-
21
-
22
-
23
-
24
-
25
-
26
-
27
-
28
-
29
-
30
-
31
-
32
-
33
-
34
-
35
-
36
-
37
-
38
-
39
-
40
-
41
-
42
-
43
-
44
-
45
-
46
-
47
-
48
-
49
-
50
-
51
-
52
-
53
-
54
-
55
-
56
-
57
-
58
-
59
-
60
-
61
-
62
-
63
-
64
-
65
-
66
-
67
-
68
-
69
-
70
-
71
-
72
-
73
-
 74
74 -
 75
75 -
 76
76 -
 77
77 -
 78
78 -
 79
79 -
 80
80 -
 81
81 -
 82
82 -
 83
83 -
 84
84 -
 85
85 -
 86
86 -
 87
87 -
 88
88 -
 89
89 -
 90
90 -
 91
91 -
 92
92 -
 93
93 -
 94
94 -
95
-
96
-
97
-
98
-
99
-
100
-
101
-
102
-
103
-
104
-
105
-
106
-
107
-
108
-
109
-
110
-
111
-
112
-
113
-
114
-
115
-
116
-
117
-
118
-
119
-
120
-
121
-
122
-
123
-
124
-
125
-
126
-
127
-
128
-
129
-
130
-
131
-
132
-
133
-
134
-
135
-
136
-
137
-
138
-
139
-
140
-
141
-
142
-
143
-
144
-
145
-
146
-
147
-
148
-
149
-
150
-
151
-
152
-
153
-
154
-
155
-
156
-
157
-
158
-
159
-
160
-
161
-
162
-
163
-
164
-
165
-
166
-
167
-
168
-
169
-
170
-
171
-
172
-
173
-
174
-
175
-
176
-
177
-
178
-
179
-
180
-
181
-
182
-
183
-
184
-
185
-
186
-
187
-
188
-
189
-
190
-
191
-
192
-
193
-
194
-
195
-
196
-
197
-
198
-
199
-
200
-
201
-
202
-
203
-
204
-
205
-
206
-
207
-
208
-
209
-
210
-
211
-
212
-
213
-
214
-
215
-
216
-
217
-
218
-
219
-
220
-
221
-
222
-
223
-
224
-
225
-
226
-
227
-
228
-
229
-
230
-
231
-
232
-
233
-
234
-
235
-
236
-
237
-
238
-
239
-
240
-
241
-
242
-
243
-
244
-
245
-
246
-
247
-
248
-
249
-
250
 |
 |

5 Sector performance 5.3.2 - 5.3.4
84 Annual Report 2013
semiconductor and building management sectors. The
luminaires industry is fragmented, with our competition
varying per region and per market segment.
Under normal economic conditions, Lighting’s sales are
generally not materially aected by seasonality.
Philips Lighting has manufacturing facilities in some 25
countries in all regions of the world, and sales
organizations in more than 60 countries. Commercial
activities in other countries are handled via distributors
working with our International Sales organization.
Lighting has approximately 46,900 employees
worldwide.
Regulatory requirements
Lighting is subject to significant regulatory
requirements in the markets where it operates. These
include the European Union’s Waste from Electrical and
Electronic Equipment (WEEE), Restriction of
Hazardous Substances (RoHS), Registration,
Evaluation, Authorization and Restriction of Chemicals
(REACH), Energy-using Products (EuP) and Energy
Performance of Buildings (EPBD) directives.
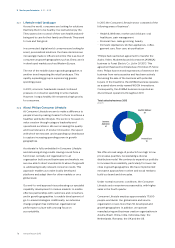
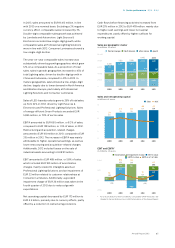
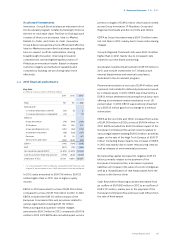
Total sales by business 2013
as a %
Light Sources &
Electronics
52
Consumer Luminaires
5
Professional
Lighting Solutions
28
Automotive
10
Lumileds
5
5.3.3 2013 highlights
In 2013, our lighting innovations underlined our four-
pillar strategy aimed at delivering even greater value for
our customers and shareholders.
Leading the technological revolution in lighting, we
delivered a number of groundbreaking innovations.
Lumileds set the standard in high and mid-power LEDs,
improving efficacy and light quality. In our drive to
continuously reduce energy consumption, Philips was
the first to show a prototype TLED providing 200
lumens per watt, which is twice as efficient as current
LED-based solutions. We also continued to pioneer
innovations in connected lighting, in segments such as
home and city lighting.
Our smart and connected CityTouch lighting system
was installed in a number of cities around the world.
This intelligent lighting system enables cities to control
light points in a dynamic and flexible way to deliver light
where and when needed, saving energy and
maintenance costs.
Our innovations in architectural lighting were used to
rejuvenate some of the best-known landmarks in the
world, such as the Bay Bridge in San Francisco, and to
create new city icons such as the fire and water-
breathing Dragon Bridge in Da Nang, Vietnam.
Underlining our expertise in integrated solutions, we
collaborated with the Rijksmuseum, Amsterdam to
develop a customized LED lighting solution for the
museum’s entire exhibition area, bringing the color and
detail of masterpieces such as Rembrandt’s Night
Watch to life as never before.
The latest innovation in Philips Hue, our
groundbreaking connected lighting system for the
home, connects to internet services, making the system
even more intelligent, with new functionality to enjoy.
We also launched ‘Friends of Hue’ – lamp fittings and
luminaires such as LivingColors Bloom and LightStrips
which enable consumers to create even richer lighting
experiences. Resulting from our partnership with
Disney, StoryLight Mickey is another addition to the
Friends of Hue portfolio. It transforms bedtime stories
into a unique experience. The Philips-Disney
partnership combines Philips’ innovation in lighting
with the magic of Disney characters and storytelling to
transform a child’s bedroom into a more imaginative
place for them to read, play and fall asleep.
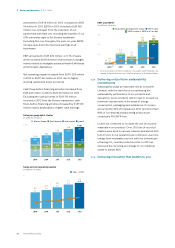
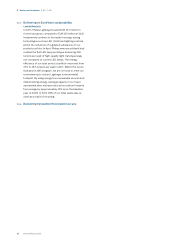
5.3.4 2013 financial performance
Key data
in millions of euros unless otherwise stated
2011 2012 2013
Sales 7,638 8,442 8,413
Sales growth
% increase, nominal 1 11 0
% increase, comparable1) 6 4 3
EBITA 1) 399 128 695
as a % of sales 5.2 1.5 8.3
EBIT (408) (66) 489
as a % of sales (5.3) (0.8) 5.8
Net operating capital (NOC)1) 4,965 4,635 4,462
Cash flows before financing activities1) 208 279 478
Employees (FTEs) 53,168 50,224 46,890
1) For a reconciliation to the most directly comparable GAAP measures, see
chapter 14, Reconciliation of non-GAAP information, of this Annual Report