Philips 2013 Annual Report Download - page 195
Download and view the complete annual report
Please find page 195 of the 2013 Philips annual report below. You can navigate through the pages in the report by either clicking on the pages listed below, or by using the keyword search tool below to find specific information within the annual report.-
 1
1 -
2
-
3
-
4
-
5
-
6
-
7
-
8
-
9
-
10
-
11
-
12
-
13
-
14
-
15
-
16
-
17
-
18
-
19
-
20
-
21
-
22
-
23
-
24
-
25
-
26
-
27
-
28
-
29
-
30
-
31
-
32
-
33
-
34
-
35
-
36
-
37
-
38
-
39
-
40
-
41
-
42
-
43
-
44
-
45
-
46
-
47
-
48
-
49
-
50
-
51
-
52
-
53
-
54
-
55
-
56
-
57
-
58
-
59
-
60
-
61
-
62
-
63
-
64
-
65
-
66
-
67
-
68
-
69
-
70
-
71
-
72
-
73
-
74
-
75
-
76
-
77
-
78
-
79
-
80
-
81
-
82
-
83
-
84
-
85
-
86
-
87
-
88
-
89
-
90
-
91
-
92
-
93
-
94
-
95
-
96
-
97
-
98
-
99
-
100
-
101
-
102
-
103
-
104
-
105
-
106
-
107
-
108
-
109
-
110
-
111
-
112
-
113
-
114
-
115
-
116
-
117
-
118
-
119
-
120
-
121
-
122
-
123
-
124
-
125
-
126
-
127
-
128
-
129
-
130
-
131
-
132
-
133
-
134
-
135
-
136
-
137
-
138
-
139
-
140
-
141
-
142
-
143
-
144
-
145
-
146
-
147
-
148
-
149
-
150
-
151
-
152
-
153
-
154
-
155
-
156
-
157
-
158
-
159
-
160
-
161
-
162
-
163
-
164
-
165
-
166
-
167
-
168
-
169
-
170
-
171
-
172
-
173
-
174
-
175
-
176
-
177
-
178
-
179
-
180
-
181
-
182
-
183
-
184
-
 185
185 -
 186
186 -
 187
187 -
 188
188 -
 189
189 -
 190
190 -
 191
191 -
 192
192 -
 193
193 -
 194
194 -
 195
195 -
 196
196 -
 197
197 -
 198
198 -
 199
199 -
 200
200 -
 201
201 -
 202
202 -
 203
203 -
 204
204 -
 205
205 -
206
-
207
-
208
-
209
-
210
-
211
-
212
-
213
-
214
-
215
-
216
-
217
-
218
-
219
-
220
-
221
-
222
-
223
-
224
-
225
-
226
-
227
-
228
-
229
-
230
-
231
-
232
-
233
-
234
-
235
-
236
-
237
-
238
-
239
-
240
-
241
-
242
-
243
-
244
-
245
-
246
-
247
-
248
-
249
-
250
 |
 |

12 Company financial statements 12.4 - 12.4 F G H I J K L
Annual Report 2013 195
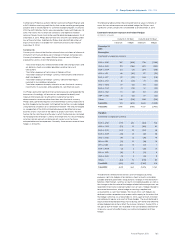
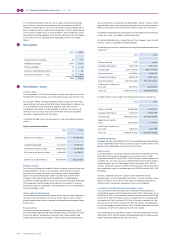
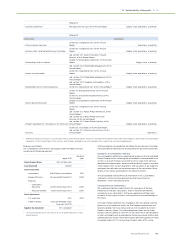
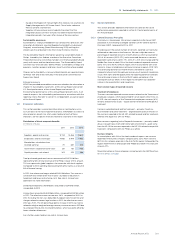
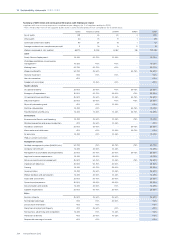
FLong-term debt and short-term debt
Long-term debt
(range of)
interest rates
average
interest rate
amount
outstanding due in 1 year
due after 1
year
due after 5
years
average
remaining
term (in years)
amount
outstanding
2012
USD bonds 3.8 - 7.8% 5.6% 2,958 − 2,958 2,059 13.7 3,198
Convertible debentures 12
Private financing 2
Intercompany financing 0.0 - 2.3% 0.7% 2,296 2,296 − − 0.6 442
Bank borrowings 1.5 - 2.2% 1.9% 450 250 200 200 3.6 450
Other long-term debt 1.8 - 19.0% 4.5% 47 47 − − 1.0 49
5,751 2,593 3,158 2,259 4,153
Corresponding data previous
year 4,153 614 3,539 3,289 4,030
The following amounts of the long-term debt as of December 31, 2013, are
due in the next five years:
2014 2,593
2015 −
2016 −
2017 −
2018 899
3,492
Corresponding amount previous year 864
Short-term debt
Short-term debt includes the current portion of outstanding external and
intercompany long-term debt of EUR 2,593 million (2012: EUR 614 million),
other debt to group companies totaling EUR 10,976 million (2012: EUR
11,015 million) and short-term bank borrowings of EUR 76 million (2012:
EUR 113 million).
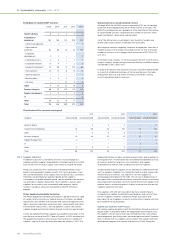
GOther current liabilities
2012 2013
Income tax payable 78 4
Other short-term liabilities 538 53
Accrued expenses 253 174
Derivative instruments - liabilities 592 471
1,461 702
In 2012, Other short-term liabilities included a payable amount of EUR 509
million related to a fine from the European Commission following an
investigation into alleged violation of competition rules in the Cathode-
Ray Tubes (CRT) industry. The payable amount represented the aggregate
of EUR 313 million paid by the Company and EUR 196 million, being 50% of
the fine related to LPD. This amount was paid in 2013 and is therefore
reflected in the reduction of other short-term liabilities compared with
2012.
HNet income
Net income in 2013 amounted to a profit of EUR 1,169 million (2012: a loss
of EUR 35 million). The increase of net results in 2013 compared to 2012 is
especially due to the financial performance of affiliated companies.
IEmployees
The number of persons employed by the Company at year-end 2013 was
10 (2012: 10) and included the members of the Board of Management and
certain leaders from functions, businesses and markets, together referred
to as the Executive Committee.
For the remuneration of past and present members of both the Board of
Management and the Supervisory Board, please refer to note 33,
Information on remuneration, which is deemed incorporated and
repeated herein by reference.
JContractual obligations and contingent liabilities not
appearing in the balance sheet
Philips entered into contracts with several venture capitalists where it
committed itself to make, under certain conditions, capital contributions
to investment funds to an aggregated amount of EUR 40 million (2012:
EUR 48 million) until June 30, 2021. As at December 31, 2013 capital
contributions already made to these investment funds are recorded as
available-for-sale financial assets within Other non-current financial
assets. Furthermore, Philips made commitments to third parties in 2013 of
EUR 16 million (2012: EUR 25 million) with respect to sponsoring activities.
The amounts are due before 2016.
General guarantees as referred to in Section 403, Book 2, of the Dutch Civil
Code, have been given by the Company on behalf of several group
companies in the Netherlands. The liabilities of these companies to third
parties and investments in associates totaled EUR 1,255 million as of year-
end 2013 (2012: EUR 1,416 million).
Guarantees totaling EUR 255 million (2012: EUR 284 million) have also
been given on behalf of other group companies and credit guarantees
totaling EUR 15 million (2012: EUR 4 million) on behalf of unconsolidated
companies and third parties. The Company is the head of a fiscal unity that
contains the most significant Dutch wholly-owned group companies. The
Company is therefore jointly and severally liable for the tax liabilities of the
tax entity as a whole. For additional information, please refer to note 26,
Contingent assets and liabilities , which is deemed incorporated and
repeated herein by reference.
KAudit fees
For a summary of the audit fees, please refer to the Group Financial
statements, note 3, Income from operations, which is deemed
incorporated and repeated herein by reference.
LSubsequent events
Dutch pension plan contribution
On July 1 2013, Philips announced that it had reached an agreement with
the Dutch trade unions on a new collective labor agreement that covers
the period January 1, 2013 till December 31, 2014. The new agreement
includes changes in the plan rules and the funding agreement with the
Dutch pension plan, which is the company’s largest Defined Benefit
pension plan. The plan changes have become eective as of January 1,
2014 and the new funding agreement has been signed by the Trustees of
the Dutch pension plan. As part of these changes, Philips agreed to make a
EUR 600 million contribution to the Dutch pension plan, of which EUR 240
million has been settled in cash on February 19, 2014. During 2014 and
2015, the remainder of the consideration will be settled through the
transfer of assets and cash proceeds from the sale of assets which are
currently owned by Philips. The (majority of the) contribution will need to
be written o through other comprehensive income due to the asset
ceiling restrictions in the plan.