Philips 2013 Annual Report Download - page 211
Download and view the complete annual report
Please find page 211 of the 2013 Philips annual report below. You can navigate through the pages in the report by either clicking on the pages listed below, or by using the keyword search tool below to find specific information within the annual report.-
 1
1 -
2
-
3
-
4
-
5
-
6
-
7
-
8
-
9
-
10
-
11
-
12
-
13
-
14
-
15
-
16
-
17
-
18
-
19
-
20
-
21
-
22
-
23
-
24
-
25
-
26
-
27
-
28
-
29
-
30
-
31
-
32
-
33
-
34
-
35
-
36
-
37
-
38
-
39
-
40
-
41
-
42
-
43
-
44
-
45
-
46
-
47
-
48
-
49
-
50
-
51
-
52
-
53
-
54
-
55
-
56
-
57
-
58
-
59
-
60
-
61
-
62
-
63
-
64
-
65
-
66
-
67
-
68
-
69
-
70
-
71
-
72
-
73
-
74
-
75
-
76
-
77
-
78
-
79
-
80
-
81
-
82
-
83
-
84
-
85
-
86
-
87
-
88
-
89
-
90
-
91
-
92
-
93
-
94
-
95
-
96
-
97
-
98
-
99
-
100
-
101
-
102
-
103
-
104
-
105
-
106
-
107
-
108
-
109
-
110
-
111
-
112
-
113
-
114
-
115
-
116
-
117
-
118
-
119
-
120
-
121
-
122
-
123
-
124
-
125
-
126
-
127
-
128
-
129
-
130
-
131
-
132
-
133
-
134
-
135
-
136
-
137
-
138
-
139
-
140
-
141
-
142
-
143
-
144
-
145
-
146
-
147
-
148
-
149
-
150
-
151
-
152
-
153
-
154
-
155
-
156
-
157
-
158
-
159
-
160
-
161
-
162
-
163
-
164
-
165
-
166
-
167
-
168
-
169
-
170
-
171
-
172
-
173
-
174
-
175
-
176
-
177
-
178
-
179
-
180
-
181
-
182
-
183
-
184
-
185
-
186
-
187
-
188
-
189
-
190
-
191
-
192
-
193
-
194
-
195
-
196
-
197
-
198
-
199
-
200
-
 201
201 -
 202
202 -
 203
203 -
 204
204 -
 205
205 -
 206
206 -
 207
207 -
 208
208 -
 209
209 -
 210
210 -
 211
211 -
 212
212 -
 213
213 -
 214
214 -
 215
215 -
 216
216 -
 217
217 -
 218
218 -
 219
219 -
 220
220 -
 221
221 -
222
-
223
-
224
-
225
-
226
-
227
-
228
-
229
-
230
-
231
-
232
-
233
-
234
-
235
-
236
-
237
-
238
-
239
-
240
-
241
-
242
-
243
-
244
-
245
-
246
-
247
-
248
-
249
-
250
 |
 |

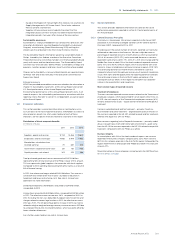
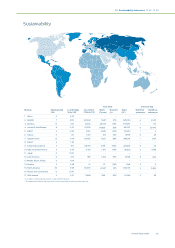
13 Sustainability statements 13.3.3 - 13.3.3
Annual Report 2013 211
11
6
10
8
9
12
15
16
2
54
3
1
13
17
14
7
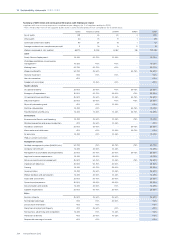
Sustainability
Markets
1. Africa
2. ASEAN
3. Benelux
4. Central & East Europe
5. DACH
6. France
7. Greater China
8. Iberia**
9. Indian Subcontinent
10. Italy, Israel and Greece
11. Japan
12. Latin America
13. Middle East & Turkey
14. Nordics
15. North America
16. Russia and Central Asia
17. UK & Ireland
Manufacturing
sites
0
7
13
8
4
4
13
2
5
4
0
6
0
2
40
0
3
Waste
(Tonnes)
–
7,827
20,057
18,628
2,926
747
7,625
–
7,316
1,614
–
1,282
–
57
21,937
–
1,918
Recycled
(%)
–
57%
89%
85%
90%
76%
86%
–
100%
66%
–
93%
–
99%
70%
–
85%
Hazardous
substances
–
5,520
177
22,045
3
36
1,724
–
24
4,738
–
780
–
0
5,366
–
38
Restricted
substances
–
4
1
0
1
0
1
–
0
0
–
0
–
0
2
–
0
CO2 emitted
(Tonnes CO2)
–
251,450
32,176
72,092
5,515
3,119
119,750
–
69,491
5,461
–
188
–
15
141,559
–
3,808
Water
(m3)
–
1,276,133
590,061
491,337
191,435
19,179
988,721
–
267,278
26,622
–
27,126
–
1,249
1,140,441
–
24,780
Total waste
Emissions (kg)
Lost Workday
Injury rate*
0.33
0.09
0.31
0.32
0.46
1.15
0.16
1.22
0.11
0.76
0.00
0.14
0.14
0.28
0.28
0.00
0.37
*Includes manufacturing and non-manufacturing sites
**Acquired manufacturing sites did not start reporting environmental data yet