Philips 2013 Annual Report Download - page 39
Download and view the complete annual report
Please find page 39 of the 2013 Philips annual report below. You can navigate through the pages in the report by either clicking on the pages listed below, or by using the keyword search tool below to find specific information within the annual report.-
 1
1 -
2
-
3
-
4
-
5
-
6
-
7
-
8
-
9
-
10
-
11
-
12
-
13
-
14
-
15
-
16
-
17
-
18
-
19
-
20
-
21
-
22
-
23
-
24
-
25
-
26
-
27
-
28
-
 29
29 -
 30
30 -
 31
31 -
 32
32 -
 33
33 -
 34
34 -
 35
35 -
 36
36 -
 37
37 -
 38
38 -
 39
39 -
 40
40 -
 41
41 -
 42
42 -
 43
43 -
 44
44 -
 45
45 -
 46
46 -
 47
47 -
 48
48 -
 49
49 -
50
-
51
-
52
-
53
-
54
-
55
-
56
-
57
-
58
-
59
-
60
-
61
-
62
-
63
-
64
-
65
-
66
-
67
-
68
-
69
-
70
-
71
-
72
-
73
-
74
-
75
-
76
-
77
-
78
-
79
-
80
-
81
-
82
-
83
-
84
-
85
-
86
-
87
-
88
-
89
-
90
-
91
-
92
-
93
-
94
-
95
-
96
-
97
-
98
-
99
-
100
-
101
-
102
-
103
-
104
-
105
-
106
-
107
-
108
-
109
-
110
-
111
-
112
-
113
-
114
-
115
-
116
-
117
-
118
-
119
-
120
-
121
-
122
-
123
-
124
-
125
-
126
-
127
-
128
-
129
-
130
-
131
-
132
-
133
-
134
-
135
-
136
-
137
-
138
-
139
-
140
-
141
-
142
-
143
-
144
-
145
-
146
-
147
-
148
-
149
-
150
-
151
-
152
-
153
-
154
-
155
-
156
-
157
-
158
-
159
-
160
-
161
-
162
-
163
-
164
-
165
-
166
-
167
-
168
-
169
-
170
-
171
-
172
-
173
-
174
-
175
-
176
-
177
-
178
-
179
-
180
-
181
-
182
-
183
-
184
-
185
-
186
-
187
-
188
-
189
-
190
-
191
-
192
-
193
-
194
-
195
-
196
-
197
-
198
-
199
-
200
-
201
-
202
-
203
-
204
-
205
-
206
-
207
-
208
-
209
-
210
-
211
-
212
-
213
-
214
-
215
-
216
-
217
-
218
-
219
-
220
-
221
-
222
-
223
-
224
-
225
-
226
-
227
-
228
-
229
-
230
-
231
-
232
-
233
-
234
-
235
-
236
-
237
-
238
-
239
-
240
-
241
-
242
-
243
-
244
-
245
-
246
-
247
-
248
-
249
-
250
 |
 |

4 Group performance 4.1 - 4.1.1
Annual Report 2013 39
4.1 Financial
performance
Prior-period financial statements have been restated
for the treatment of Audio, Video, Multimedia and
Accessories as discontinued operations (see note 7,
Discontinued operations and other assets classified as
held for sale) and the adoption of IAS 19R, which mainly
relates to accounting for pensions (see note 30, Post-
employment benefits).
Management summary
Key data
in millions of euros unless otherwise stated
2011 2012 2013
Sales 20,992 23,457 23,329
EBITA1) 1,435 1,106 2,451
as a % of sales 6.8 4.7 10.5
EBIT (479) 648 1,991
as a % of sales (2.3) 2.8 8.5
Financial income and expenses (331) (329) (330)
Income tax expense (251) (185) (466)
Results of investments in associates 15 (211) (25)
Income (loss) from continuing
operations (1,046) (77) 1,170
Income (loss) from discontinued
operations - net of income tax (410) 47 2
Net income (loss) (1,456) (30) 1,172
Net income attributable to
shareholders per common share in
euros:
- basic (1.53) (0.04) 1.28
- diluted (1.53) (0.04) 1.27
Net operating capital (NOC)1) 10,382 9,316 10,238
Cash flows before financing activities1) (515) 1,157 141
Employees (FTEs) 125,240 118,087 116,681
of which discontinued operations 5,645 2,005 1,992
1) For a reconciliation to the most directly comparable GAAP measures, see
chapter 14, Reconciliation of non-GAAP information, of this Annual Report
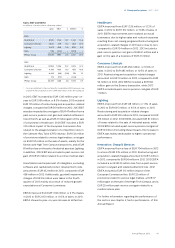
The year 2013
• In 2013 we continued to make good progress in a
challenging economic environment, particularly in
the United States and Western Europe. We recorded
3% comparable sales growth (1% nominal decline),
with a strong contribution from growth geographies.
The profitability improved substantially, with all
sectors delivering solid earnings. Net income for the
year amounted to EUR 1,172 million, mainly driven by
strong operational performance, including significant
gross margin improvement and productivity gains
coming from the Accelerate! program.
• Sales amounted to EUR 23.3 billion, a 1% nominal
decline for the year. Excluding unfavorable currency
eects, comparable sales were 3% above 2012,
driven by all three operating sectors. Healthcare
sales grew 1%, mainly driven by Customer Services.
Lighting sales were 3% above 2012, driven by
Lumileds and Automotive, partly tempered by a sales
decline at Consumer Luminaires. Sales at Consumer
Lifestyle were 10% above 2012, with double-digit
growth at Domestic Appliances and high-single-digit
growth at Personal Care and Health & Wellness.
• Our growth geographies achieved 11% comparable
growth, while mature geographies declined by 1%, as
a result of the overall macroeconomic developments,
including the continued weakness of the Western
European markets and the continued economic
uncertainty in North America. In 2013, growth
geographies accounted for 36% of total sales,
compared to 34% in 2012.
• EBIT amounted to EUR 1,991 million, or 8.5% of sales,
compared to EUR 648 million, or 2.8% of sales, in
2012. EBIT improvement was seen at all sectors, but
was mainly driven by Lighting and Healthcare.
• In 2013 we generated EUR 1,138 million of cash flow
from operating activities, which was EUR 944 million
lower than in 2012. The decrease is mainly a result of
the payment of the European Commission fine in Q1
2013, increased working capital requirements and the
payout of restructuring provisions in 2013. Our cash
flows before financing activities were EUR 1,016
million lower than in 2012, due to a decrease in cash
flows from operating activities and proceeds from
divestments, partly oset by lower outflows related
to acquisitions of new businesses.
• In 2013 we completed the execution of our EUR 2
billion share buy-back program, thereby improving
the efficiency of our balance sheet, and announced a
new EUR 1.5 billion program to be concluded over the
next 2-3 years. By the end of the year we had
completed 7% of this program.
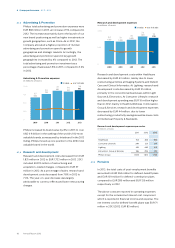
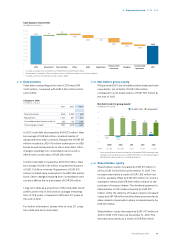
4.1.1 Sales
The composition of sales growth in percentage terms in
2013, compared to 2012, is presented in the table below.