Regions Bank 2009 Annual Report Download - page 106
Download and view the complete annual report
Please find page 106 of the 2009 Regions Bank annual report below. You can navigate through the pages in the report by either clicking on the pages listed below, or by using the keyword search tool below to find specific information within the annual report.-
 1
1 -
2
-
3
-
4
-
5
-
6
-
7
-
8
-
9
-
10
-
11
-
12
-
13
-
14
-
15
-
16
-
17
-
18
-
19
-
20
-
21
-
22
-
23
-
24
-
25
-
26
-
27
-
28
-
29
-
30
-
31
-
32
-
33
-
34
-
35
-
36
-
37
-
38
-
39
-
40
-
41
-
42
-
43
-
44
-
45
-
46
-
47
-
48
-
49
-
50
-
51
-
52
-
53
-
54
-
55
-
56
-
57
-
58
-
59
-
60
-
61
-
62
-
63
-
64
-
65
-
66
-
67
-
68
-
69
-
70
-
71
-
72
-
73
-
74
-
75
-
76
-
77
-
78
-
79
-
80
-
81
-
82
-
83
-
84
-
85
-
86
-
87
-
88
-
89
-
90
-
91
-
92
-
93
-
94
-
95
-
 96
96 -
 97
97 -
 98
98 -
 99
99 -
 100
100 -
 101
101 -
 102
102 -
 103
103 -
 104
104 -
 105
105 -
 106
106 -
 107
107 -
 108
108 -
 109
109 -
 110
110 -
 111
111 -
 112
112 -
 113
113 -
 114
114 -
 115
115 -
 116
116 -
117
-
118
-
119
-
120
-
121
-
122
-
123
-
124
-
125
-
126
-
127
-
128
-
129
-
130
-
131
-
132
-
133
-
134
-
135
-
136
-
137
-
138
-
139
-
140
-
141
-
142
-
143
-
144
-
145
-
146
-
147
-
148
-
149
-
150
-
151
-
152
-
153
-
154
-
155
-
156
-
157
-
158
-
159
-
160
-
161
-
162
-
163
-
164
-
165
-
166
-
167
-
168
-
169
-
170
-
171
-
172
-
173
-
174
-
175
-
176
-
177
-
178
-
179
-
180
-
181
-
182
-
183
-
184
-
185
-
186
-
187
-
188
-
189
-
190
-
191
-
192
-
193
-
194
-
195
-
196
-
197
-
198
-
199
-
200
-
201
-
202
-
203
-
204
-
205
-
206
-
207
-
208
-
209
-
210
-
211
-
212
-
213
-
214
-
215
-
216
-
217
-
218
-
219
-
220
 |
 |

Certain components of investor real estate carry a higher risk of non-collection. Beginning in 2009, multi-
family and retail loans experienced increased pressure and contributed to increases in non-accrual loans.
Continued weak economic conditions impacted demand for products and services in these sectors. Lower
demand impacted cash flows generated by these properties, leading to a higher rate of non-collection for these
types of loans. Offsetting the risk of non-collection is the geographic diversity of Regions’ exposure. The
Company expects continued credit pressure on loans secured by income-producing commercial real estate during
2010. Credit risk for these loan types is directly correlated with such factors as the level of unemployment,
vacancy rates and rental income within Regions’ footprint. Additionally, because of the cash flow associated with
income-producing loans, the Company can more easily restructure these loans than other types of investor real
estate loans. Accordingly, the loss content is expected to be generally lower than other types of investor real
estate.
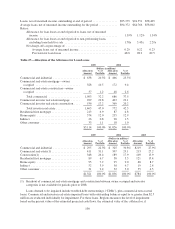
The following table presents credit metrics and geographic distribution for Regions’ multi-family and retail
loans for the years ended December 31, 2009 and 2008:
Table 22—Multi-family and Retail
2009(1) 2008
(In millions, net of
unearned income)
Multi-family
Loan balance ................................................... $5,049 $4,377
90 days past due ................................................ 1 —
Non-accruing loans .............................................. 113 15
(1) The majority of the balance related to multi-family loans is geographically distributed throughout the
following areas: Texas 20%, Florida 14%, Georgia 9%, Tennessee 7%, Louisiana 7% and Alabama
6%. All other states, none of which comprise more than 5%, make up the remainder of the balance.
2009(1) 2008
(In millions, net of
unearned income)
Retail
Loan balance ................................................... $4,120 $4,424
90 days past due ................................................ 4 —
Non-accruing loans .............................................. 288 21
(1) The majority of the balance related to retail loans is geographically distributed throughout the
following areas: Florida 21%, Texas 13%, Alabama 10%, Georgia 9%, Tennessee 8% and North
Carolina 7%. All other states, none of which comprise more than 5%, make up the remainder of the
balance.
The increase in fundings of multi-family construction commitments existing at December 31, 2008 drove
the year-over-year increase in loan balances. While retail and multi-family categories experienced an increase in
non-accrual loans, these categories were not a major driver of charge-offs for the periods presented.
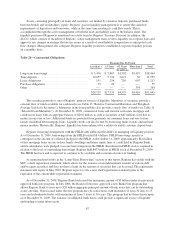
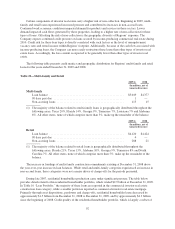
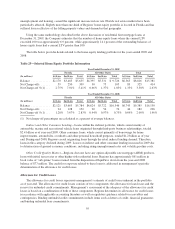
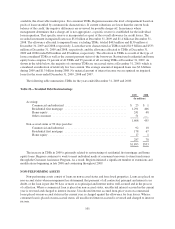
During late 2007, residential homebuilder production came under significant pressure. The table below
provides detail related to this residential homebuilder portfolio, which totaled $2.9 billion at December 31, 2009.
In Table 10 “Loan Portfolio,” the majority of these loans are reported in the commercial investor real estate
construction loan category, while a smaller portion is reported as commercial investor real estate mortgage.
Primarily through asset dispositions, paydowns and charge-offs, residential homebuilder loans decreased by
approximately $1.5 billion from December 31, 2008 to December 31, 2009, and by approximately $4.3 billion
since the beginning of 2008. Credit quality of the residential homebuilder portfolio, which is largely a subset of
92