Regions Bank 2009 Annual Report Download - page 145
Download and view the complete annual report
Please find page 145 of the 2009 Regions Bank annual report below. You can navigate through the pages in the report by either clicking on the pages listed below, or by using the keyword search tool below to find specific information within the annual report.-
 1
1 -
2
-
3
-
4
-
5
-
6
-
7
-
8
-
9
-
10
-
11
-
12
-
13
-
14
-
15
-
16
-
17
-
18
-
19
-
20
-
21
-
22
-
23
-
24
-
25
-
26
-
27
-
28
-
29
-
30
-
31
-
32
-
33
-
34
-
35
-
36
-
37
-
38
-
39
-
40
-
41
-
42
-
43
-
44
-
45
-
46
-
47
-
48
-
49
-
50
-
51
-
52
-
53
-
54
-
55
-
56
-
57
-
58
-
59
-
60
-
61
-
62
-
63
-
64
-
65
-
66
-
67
-
68
-
69
-
70
-
71
-
72
-
73
-
74
-
75
-
76
-
77
-
78
-
79
-
80
-
81
-
82
-
83
-
84
-
85
-
86
-
87
-
88
-
89
-
90
-
91
-
92
-
93
-
94
-
95
-
96
-
97
-
98
-
99
-
100
-
101
-
102
-
103
-
104
-
105
-
106
-
107
-
108
-
109
-
110
-
111
-
112
-
113
-
114
-
115
-
116
-
117
-
118
-
119
-
120
-
121
-
122
-
123
-
124
-
125
-
126
-
127
-
128
-
129
-
130
-
131
-
132
-
133
-
134
-
 135
135 -
 136
136 -
 137
137 -
 138
138 -
 139
139 -
 140
140 -
 141
141 -
 142
142 -
 143
143 -
 144
144 -
 145
145 -
 146
146 -
 147
147 -
 148
148 -
 149
149 -
 150
150 -
 151
151 -
 152
152 -
 153
153 -
 154
154 -
 155
155 -
156
-
157
-
158
-
159
-
160
-
161
-
162
-
163
-
164
-
165
-
166
-
167
-
168
-
169
-
170
-
171
-
172
-
173
-
174
-
175
-
176
-
177
-
178
-
179
-
180
-
181
-
182
-
183
-
184
-
185
-
186
-
187
-
188
-
189
-
190
-
191
-
192
-
193
-
194
-
195
-
196
-
197
-
198
-
199
-
200
-
201
-
202
-
203
-
204
-
205
-
206
-
207
-
208
-
209
-
210
-
211
-
212
-
213
-
214
-
215
-
216
-
217
-
218
-
219
-
220
 |
 |

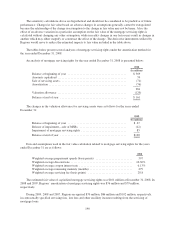
nature of the management activities of the general partner, Regions is not the primary beneficiary of these
partnerships and accounts for these investments using the equity method. Regions’ equity method investments as
of December 31, 2009 and 2008 were $827 million and $710 million, respectively, which are included in other
assets. Regions reports its equity share of the partnership gains and losses as an adjustment to non-interest
income. The Company also receives credits toward its federal income tax liabilities, which are reported as a
reduction of income tax expense (or increase to income tax benefit) and a reduction of federal income taxes
payable. Unfunded commitments to the partnerships included in other liabilities were $258 million and $298
million as of December 31, 2009 and 2008, respectively. Additionally, Regions has short-term construction loans
or letters of credit commitments with certain of the partnerships totaling $324 million and $188 million as of
December 31, 2009 and 2008, respectively. The funded portion of these loans and letters of credit was $150
million and $115 million at December 31, 2009 and 2008, respectively. The funded portion is classified as
commercial and industrial loans on the consolidated balance sheets.
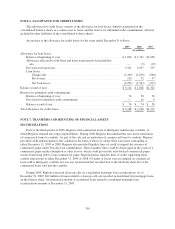
NOTE 3. DISCONTINUED OPERATIONS
On March 30, 2007, Regions sold EquiFirst Corporation (“EquiFirst”), a wholly owned non-conforming
mortgage origination subsidiary. Consequently, the business related to EquiFirst has been accounted for as
discontinued operations and the results are presented separately on the consolidated statements of operations for
all periods presented. Resolution of the sales price was completed in October 2008, resulting in an after-tax loss
of approximately $10 million.
Prior to the sale of EquiFirst and excluding the loss on the sale, Regions recorded, during 2007,
approximately $142 million in after-tax losses related to the operations of EquiFirst. The primary factor in the
recognition of these losses was the significant and rapid deterioration of the sub-prime market during the first
three months of 2007.
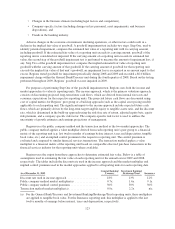
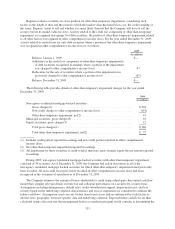
The results from discontinued operations did not impact the year ending December 31, 2009. The results
from discontinued operations for the years ending December 31, 2008, and 2007 are as follows:
2008 2007
(In millions)
Net interest income ............................................ $— $ 12
Provision for loan losses ........................................ — —
Net interest income after provision for loan losses .................... — 12
Total non-interest income, excluding gain on sale of discontinued
operations .................................................. — (189)
Total non-interest expense ....................................... 18 52
Loss from discontinued operations before income taxes ............ (18) (229)
Gain on sale of discontinued operations before income taxes ........ — 12
Loss from discontinued operations before income taxes ............ (18) (217)
Income tax benefit ......................................... (7) (75)
Loss from discontinued operations, net of tax .................... $(11) $(142)
131