Regions Bank 2009 Annual Report Download - page 182
Download and view the complete annual report
Please find page 182 of the 2009 Regions Bank annual report below. You can navigate through the pages in the report by either clicking on the pages listed below, or by using the keyword search tool below to find specific information within the annual report.-
 1
1 -
2
-
3
-
4
-
5
-
6
-
7
-
8
-
9
-
10
-
11
-
12
-
13
-
14
-
15
-
16
-
17
-
18
-
19
-
20
-
21
-
22
-
23
-
24
-
25
-
26
-
27
-
28
-
29
-
30
-
31
-
32
-
33
-
34
-
35
-
36
-
37
-
38
-
39
-
40
-
41
-
42
-
43
-
44
-
45
-
46
-
47
-
48
-
49
-
50
-
51
-
52
-
53
-
54
-
55
-
56
-
57
-
58
-
59
-
60
-
61
-
62
-
63
-
64
-
65
-
66
-
67
-
68
-
69
-
70
-
71
-
72
-
73
-
74
-
75
-
76
-
77
-
78
-
79
-
80
-
81
-
82
-
83
-
84
-
85
-
86
-
87
-
88
-
89
-
90
-
91
-
92
-
93
-
94
-
95
-
96
-
97
-
98
-
99
-
100
-
101
-
102
-
103
-
104
-
105
-
106
-
107
-
108
-
109
-
110
-
111
-
112
-
113
-
114
-
115
-
116
-
117
-
118
-
119
-
120
-
121
-
122
-
123
-
124
-
125
-
126
-
127
-
128
-
129
-
130
-
131
-
132
-
133
-
134
-
135
-
136
-
137
-
138
-
139
-
140
-
141
-
142
-
143
-
144
-
145
-
146
-
147
-
148
-
149
-
150
-
151
-
152
-
153
-
154
-
155
-
156
-
157
-
158
-
159
-
160
-
161
-
162
-
163
-
164
-
165
-
166
-
167
-
168
-
169
-
170
-
171
-
 172
172 -
 173
173 -
 174
174 -
 175
175 -
 176
176 -
 177
177 -
 178
178 -
 179
179 -
 180
180 -
 181
181 -
 182
182 -
 183
183 -
 184
184 -
 185
185 -
 186
186 -
 187
187 -
 188
188 -
 189
189 -
 190
190 -
 191
191 -
 192
192 -
193
-
194
-
195
-
196
-
197
-
198
-
199
-
200
-
201
-
202
-
203
-
204
-
205
-
206
-
207
-
208
-
209
-
210
-
211
-
212
-
213
-
214
-
215
-
216
-
217
-
218
-
219
-
220
 |
 |

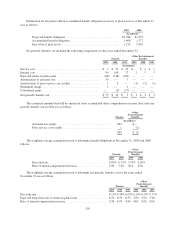
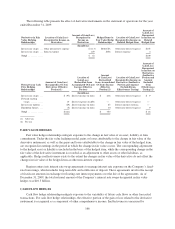
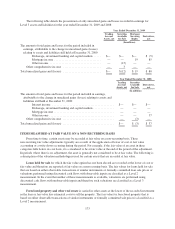
asset/liability management function. Separate derivative contracts are entered into to reduce overall market
exposure to pre-defined limits. The contracts in this portfolio do not qualify for hedge accounting and are
marked-to-market through earnings and included in other assets and other liabilities. As of December 31, 2009,
the total absolute notional amount of the Company’s derivatives trading portfolio was $63.9 billion.
In the normal course of business, Morgan Keegan enters into underwriting and forward and future
commitments on U.S. Government and municipal securities. As of December 31, 2009, no forward and future
commitments were held. The brokerage subsidiary typically settles its position by entering into equal but
opposite contracts and, as such, the contract amounts do not necessarily represent future cash requirements.
Settlement of the transactions relating to such commitments is not expected to have a material effect on the
subsidiary’s financial position. Transactions involving future settlement give rise to market risk, which represents
the potential loss that can be caused by a change in the market value of a particular financial instrument. The
exposure to market risk is determined by a number of factors, including size, composition and diversification of
positions held, the absolute and relative levels of interest rates, and market volatility.
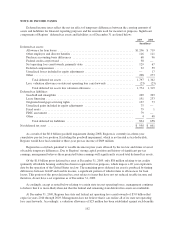
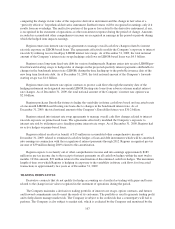
Regions enters into interest rate lock commitments, which are commitments to originate mortgage loans
whereby the interest rate on the loan is determined prior to funding and the customers have locked into that
interest rate. At December 31, 2009, Regions had $368 million in total notional amount of rate lock
commitments. Regions manages market risk on interest rate lock commitments and mortgage loans held for sale
with corresponding forward sale commitments, which are recorded at fair value with changes in fair value
recorded in mortgage income. At December 31, 2009, Regions had $1.1 billion in total absolute notional amount
related to these forward rate commitments.
On January 1, 2009, Regions made an election to account for mortgage servicing rights at fair market value
with any changes to fair value being recorded within mortgage income. Concurrent with the election to use the
fair value measurement method, Regions began using various derivative instruments, in the form of forward rate
commitments and futures contracts, to mitigate the statement of operations effect of changes in the fair value of
its mortgage servicing rights. As of December 31, 2009, the total notional amount related to these contracts was
$275 million.
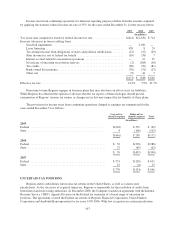
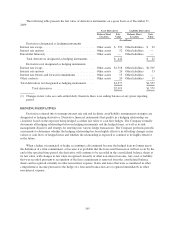
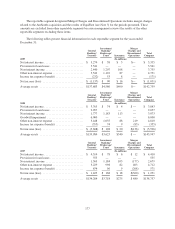
The following table presents information for derivatives not designated as hedging instruments in the
statement of operations for the year ended December 31, 2009:
Derivatives Not Designated as Hedging Instruments
Location of Gain(Loss)
Recognized in Income
on Derivatives
Amount of Gain(Loss)
Recognized in Income
on Derivatives
(In millions)
Interest rate swaps ......................................... Brokerage income $ 4
Interest rate options ........................................ Brokerage income (43)
Interest rate options ........................................ Mortgage income (8)
Interest rate futures and forward commitments .................. Brokerage income 7
Interest rate futures and forward commitments .................. Mortgage income 50
Other contracts ........................................... Brokerage income 2
$12
Credit risk, defined as all positive exposures not collateralized with cash or other assets, at December 31,
2009, totaled approximately $956 million. This amount represents the net credit risk on all trading and other
derivative positions held by Regions.
168