Regions Bank 2009 Annual Report Download - page 137
Download and view the complete annual report
Please find page 137 of the 2009 Regions Bank annual report below. You can navigate through the pages in the report by either clicking on the pages listed below, or by using the keyword search tool below to find specific information within the annual report.-
 1
1 -
2
-
3
-
4
-
5
-
6
-
7
-
8
-
9
-
10
-
11
-
12
-
13
-
14
-
15
-
16
-
17
-
18
-
19
-
20
-
21
-
22
-
23
-
24
-
25
-
26
-
27
-
28
-
29
-
30
-
31
-
32
-
33
-
34
-
35
-
36
-
37
-
38
-
39
-
40
-
41
-
42
-
43
-
44
-
45
-
46
-
47
-
48
-
49
-
50
-
51
-
52
-
53
-
54
-
55
-
56
-
57
-
58
-
59
-
60
-
61
-
62
-
63
-
64
-
65
-
66
-
67
-
68
-
69
-
70
-
71
-
72
-
73
-
74
-
75
-
76
-
77
-
78
-
79
-
80
-
81
-
82
-
83
-
84
-
85
-
86
-
87
-
88
-
89
-
90
-
91
-
92
-
93
-
94
-
95
-
96
-
97
-
98
-
99
-
100
-
101
-
102
-
103
-
104
-
105
-
106
-
107
-
108
-
109
-
110
-
111
-
112
-
113
-
114
-
115
-
116
-
117
-
118
-
119
-
120
-
121
-
122
-
123
-
124
-
125
-
126
-
 127
127 -
 128
128 -
 129
129 -
 130
130 -
 131
131 -
 132
132 -
 133
133 -
 134
134 -
 135
135 -
 136
136 -
 137
137 -
 138
138 -
 139
139 -
 140
140 -
 141
141 -
 142
142 -
 143
143 -
 144
144 -
 145
145 -
 146
146 -
 147
147 -
148
-
149
-
150
-
151
-
152
-
153
-
154
-
155
-
156
-
157
-
158
-
159
-
160
-
161
-
162
-
163
-
164
-
165
-
166
-
167
-
168
-
169
-
170
-
171
-
172
-
173
-
174
-
175
-
176
-
177
-
178
-
179
-
180
-
181
-
182
-
183
-
184
-
185
-
186
-
187
-
188
-
189
-
190
-
191
-
192
-
193
-
194
-
195
-
196
-
197
-
198
-
199
-
200
-
201
-
202
-
203
-
204
-
205
-
206
-
207
-
208
-
209
-
210
-
211
-
212
-
213
-
214
-
215
-
216
-
217
-
218
-
219
-
220
 |
 |

• Changes in the business climate (including legal factors and competition),
• Company-specific factors (including changes in key personnel, asset impairments, and business
dispositions), and
• Trends in the banking industry.
Adverse changes in the economic environment, declining operations, or other factors could result in a
decline in the implied fair value of goodwill. A goodwill impairment test includes two steps. Step One, used to
identify potential impairment, compares the estimated fair value of a reporting unit with its carrying amount,
including goodwill. If the estimated fair value of a reporting unit exceeds its carrying amount, goodwill of the
reporting unit is considered not impaired. If the carrying amount of a reporting unit exceeds its estimated fair
value, the second step of the goodwill impairment test is performed to measure the amount of impairment loss, if
any. Step Two of the goodwill impairment test compares the implied estimated fair value of reporting unit
goodwill with the carrying amount of that goodwill. If the carrying amount of goodwill for that reporting unit
exceeds the implied fair value of that unit’s goodwill, an impairment loss is recognized in an amount equal to that
excess. Regions tested goodwill for impairment periodically during 2008 and 2009 and recorded a $6.0 billion
impairment charge within the General Bank/Treasury unit during the fourth quarter of 2008. Based on the testing
performed throughout 2009, Regions’ goodwill was not impaired in 2009.
For purposes of performing Step One of the goodwill impairment test, Regions uses both the income and
market approaches to value its reporting units. The income approach, which is the primary valuation approach,
consists of discounting projected long-term future cash flows, which are derived from internal forecasts and
economic expectations for the respective reporting units. The projected future cash flows are discounted using
cost of capital metrics for Regions’ peer group or a build-up approach (such as the capital asset pricing model)
applicable to each reporting unit. The significant inputs to the income approach include expected future cash
flows, which are primarily driven by the long-term target tangible equity to tangible assets ratio, and the discount
rate, which is determined in the build-up approach using the risk-free rate of return, adjusted equity beta, equity
risk premium, and a company-specific risk factor. The company-specific risk factor is used to address the
uncertainty of growth estimates and earnings projections of management.
Regions uses the public company method and the transaction method as the two market approaches. The
public company method applies a value multiplier derived from each reporting unit’s peer group to a financial
metric of the reporting unit (e.g. last twelve months of earnings before interest, taxes and depreciation, tangible
book value, etc.) and an implied control premium to the respective reporting unit. The control premium is
evaluated and compared to similar financial services transactions. The transaction method applies a value
multiplier to a financial metric of the reporting unit based on comparable observed purchase transactions in the
financial services industry for the reporting unit (where available).
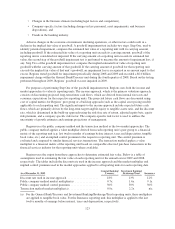
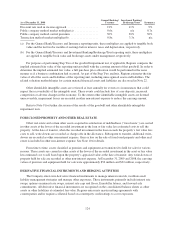
Regions uses the output from these approaches to determine estimated fair value. Below is a table of
assumptions used in estimating the fair value of each reporting unit for the annual tests in 2009 and 2008,
respectively. The tables include the discount rate used in the income approach and the market multiplier and
implied control premium used in the market approaches applied to all reporting units for each reporting date.
As of December 31, 2009
General Banking/
Treasury
Investment Banking/
Brokerage/Trust Insurance
Discount rate used in income approach ..................... 18% 13% 12%
Public company method market multiplier(a) ................ 0.7x 1.6x 9.1x
Public company method control premium ................... 30% 30% 30%
Transaction method market multiplier(a) .................... 0.9x 2.2x n/a
(a) For the General Bank/Treasury and Investment Banking/Brokerage/Trust reporting units, these multipliers
are applied to tangible book value. For the Insurance reporting unit, this multiplier is applied to the last
twelve months of earnings before interest, taxes and depreciation, respectively.
123