Regions Bank 2009 Annual Report Download - page 109
Download and view the complete annual report
Please find page 109 of the 2009 Regions Bank annual report below. You can navigate through the pages in the report by either clicking on the pages listed below, or by using the keyword search tool below to find specific information within the annual report.-
 1
1 -
2
-
3
-
4
-
5
-
6
-
7
-
8
-
9
-
10
-
11
-
12
-
13
-
14
-
15
-
16
-
17
-
18
-
19
-
20
-
21
-
22
-
23
-
24
-
25
-
26
-
27
-
28
-
29
-
30
-
31
-
32
-
33
-
34
-
35
-
36
-
37
-
38
-
39
-
40
-
41
-
42
-
43
-
44
-
45
-
46
-
47
-
48
-
49
-
50
-
51
-
52
-
53
-
54
-
55
-
56
-
57
-
58
-
59
-
60
-
61
-
62
-
63
-
64
-
65
-
66
-
67
-
68
-
69
-
70
-
71
-
72
-
73
-
74
-
75
-
76
-
77
-
78
-
79
-
80
-
81
-
82
-
83
-
84
-
85
-
86
-
87
-
88
-
89
-
90
-
91
-
92
-
93
-
94
-
95
-
96
-
97
-
98
-
 99
99 -
 100
100 -
 101
101 -
 102
102 -
 103
103 -
 104
104 -
 105
105 -
 106
106 -
 107
107 -
 108
108 -
 109
109 -
 110
110 -
 111
111 -
 112
112 -
 113
113 -
 114
114 -
 115
115 -
 116
116 -
 117
117 -
 118
118 -
 119
119 -
120
-
121
-
122
-
123
-
124
-
125
-
126
-
127
-
128
-
129
-
130
-
131
-
132
-
133
-
134
-
135
-
136
-
137
-
138
-
139
-
140
-
141
-
142
-
143
-
144
-
145
-
146
-
147
-
148
-
149
-
150
-
151
-
152
-
153
-
154
-
155
-
156
-
157
-
158
-
159
-
160
-
161
-
162
-
163
-
164
-
165
-
166
-
167
-
168
-
169
-
170
-
171
-
172
-
173
-
174
-
175
-
176
-
177
-
178
-
179
-
180
-
181
-
182
-
183
-
184
-
185
-
186
-
187
-
188
-
189
-
190
-
191
-
192
-
193
-
194
-
195
-
196
-
197
-
198
-
199
-
200
-
201
-
202
-
203
-
204
-
205
-
206
-
207
-
208
-
209
-
210
-
211
-
212
-
213
-
214
-
215
-
216
-
217
-
218
-
219
-
220
 |
 |

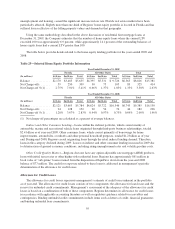
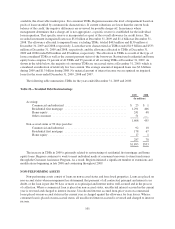
unemployment and housing, caused the significant increase in loss rate. Florida real estate markets have been
particularly affected. Slightly more than one-third of Regions’ home equity portfolio is located in Florida and has
suffered losses reflective of the falling property values and demand in that geography.
Using the same methodology described in the above discussion of residential first mortgage loans, at
December 31, 2009, the Company estimates that the number of home equity loans where the current LTV
exceeded 100 was approximately 6.9 percent, while approximately 14.1 percent of the outstanding balances of
home equity loans had a current LTV greater than 100.
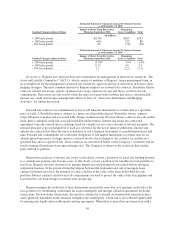
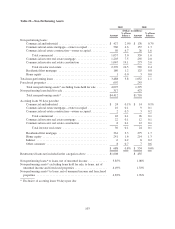
The table below provides details related to the home equity lending portfolio for the years-ended 2009 and
2008:
Table 25—Selected Home Equity Portfolio Information
Year Ended December 31, 2009
Florida All Other States Total
(In millions) 1st Lien 2nd Lien Total 1st Lien 2nd Lien Total 1st Lien 2nd Lien Total
Balance ............. $2,170 $3,485 $5,655 $4,395 $5,331 $ 9,726 $6,565 $8,816 $15,381
Net Charge-offs ...... 59 250 309 30 75 105 89 325 414
Net Charge-off %(1) . . . 2.75% 7.01% 5.41% 0.66% 1.37% 1.05% 1.33% 3.58% 2.63%
Year Ended December 31, 2008
Florida All Other States Total
(In millions) 1st Lien 2nd Lien Total 1st Lien 2nd Lien Total 1st Lien 2nd Lien Total
Balance ............. $2,121 $3,663 $5,784 $4,624 $5,722 $10,346 $6,745 $9,385 $16,130
Net Charge-offs ...... 24 128 152 20 54 74 44 182 226
Net Charge-off %(1) . . . 1.28% 3.67% 2.83% 0.44% 0.97% 0.73% 0.69% 2.00% 1.46%
(1) Net charge-off percentages are calculated as a percent of average balances.
Indirect and Other Consumer Lending—Loans within the indirect portfolio, which consist mainly of
automobile, marine and recreational vehicle loans originated through third-party business relationships, totaled
$2.4 billion as of year-end 2009. Other consumer loans, which consist primarily of borrowings for home
improvements, automobiles, overdrafts and other personal household purposes, totaled $1.2 billion as of year
end. During mid-2008, Regions ceased originating loans through the retail indirect lending channel. Therefore,
loans in this category declined during 2009. Losses on indirect and other consumer lending increased in 2009 due
to deterioration of general economic conditions, including rising unemployment rates and volatile gasoline costs.
Other Credit Quality Matters—Regions does not have any option adjustable rate mortgage (ARM) products,
loans with initial teaser rates or other higher-risk residential loans. Regions has approximately $61 million in
book value of “sub-prime” loans retained from the disposition of EquiFirst, down from the year-end 2008
balance of $77 million. The credit loss exposure related to these loans is addressed in management’s periodic
determination of the allowance for credit losses.
Allowance for Credit Losses
The allowance for credit losses represents management’s estimate of credit losses inherent in the portfolio
as of year-end. The allowance for credit losses consists of two components: the allowance for loan losses and the
reserve for unfunded credit commitments. Management’s assessment of the adequacy of the allowance for credit
losses is based on a combination of both of these components. Regions determines its allowance for credit losses
in accordance with applicable accounting literature as well as regulatory guidance related to receivables and
contingencies. Binding unfunded credit commitments include items such as letters of credit, financial guarantees
and binding unfunded loan commitments.
95