Regions Bank 2009 Annual Report Download - page 85
Download and view the complete annual report
Please find page 85 of the 2009 Regions Bank annual report below. You can navigate through the pages in the report by either clicking on the pages listed below, or by using the keyword search tool below to find specific information within the annual report.-
 1
1 -
2
-
3
-
4
-
5
-
6
-
7
-
8
-
9
-
10
-
11
-
12
-
13
-
14
-
15
-
16
-
17
-
18
-
19
-
20
-
21
-
22
-
23
-
24
-
25
-
26
-
27
-
28
-
29
-
30
-
31
-
32
-
33
-
34
-
35
-
36
-
37
-
38
-
39
-
40
-
41
-
42
-
43
-
44
-
45
-
46
-
47
-
48
-
49
-
50
-
51
-
52
-
53
-
54
-
55
-
56
-
57
-
58
-
59
-
60
-
61
-
62
-
63
-
64
-
65
-
66
-
67
-
68
-
69
-
70
-
71
-
72
-
73
-
74
-
 75
75 -
 76
76 -
 77
77 -
 78
78 -
 79
79 -
 80
80 -
 81
81 -
 82
82 -
 83
83 -
 84
84 -
 85
85 -
 86
86 -
 87
87 -
 88
88 -
 89
89 -
 90
90 -
 91
91 -
 92
92 -
 93
93 -
 94
94 -
 95
95 -
96
-
97
-
98
-
99
-
100
-
101
-
102
-
103
-
104
-
105
-
106
-
107
-
108
-
109
-
110
-
111
-
112
-
113
-
114
-
115
-
116
-
117
-
118
-
119
-
120
-
121
-
122
-
123
-
124
-
125
-
126
-
127
-
128
-
129
-
130
-
131
-
132
-
133
-
134
-
135
-
136
-
137
-
138
-
139
-
140
-
141
-
142
-
143
-
144
-
145
-
146
-
147
-
148
-
149
-
150
-
151
-
152
-
153
-
154
-
155
-
156
-
157
-
158
-
159
-
160
-
161
-
162
-
163
-
164
-
165
-
166
-
167
-
168
-
169
-
170
-
171
-
172
-
173
-
174
-
175
-
176
-
177
-
178
-
179
-
180
-
181
-
182
-
183
-
184
-
185
-
186
-
187
-
188
-
189
-
190
-
191
-
192
-
193
-
194
-
195
-
196
-
197
-
198
-
199
-
200
-
201
-
202
-
203
-
204
-
205
-
206
-
207
-
208
-
209
-
210
-
211
-
212
-
213
-
214
-
215
-
216
-
217
-
218
-
219
-
220
 |
 |

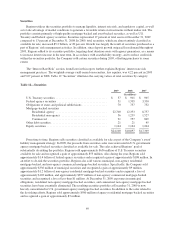
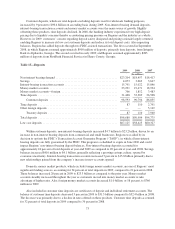
Portfolio Quality—Regions’ investment policy emphasizes credit quality and liquidity. Securities rated in
the highest category by nationally recognized rating agencies and securities backed by the U.S. Government and
government sponsored agencies, both on a direct and indirect basis, represented approximately 99.5 percent of
the investment portfolio at December 31, 2009. State, county, and local municipal securities rated below single A
or which are non-rated represented only 0.5 percent of total securities at year-end 2009. Due to the potential for
downside price risk, the Company eliminated its exposure in non-agency commercial mortgage-backed
securities, non-agency residential mortgage-backed securities and municipal bonds during the year. This was
executed in order to reduce credit risk within the portfolio. Also, Regions increased its liquidity by reinvesting
the proceeds in agency securities.
Cash and Cash Equivalents
Cash and cash equivalents include cash and due from banks, interest-bearing deposits in other banks
(including the Federal Reserve Bank), and federal funds sold and securities purchased under agreements to resell
(which have a life of 90 days or less). At December 31, 2009, these assets totaled $8 billion as compared to $11
billion at December 31, 2008. The year-over-year decrease was primarily driven by a reduction in Regions’
interest-bearing deposits in other banks, primarily lower balances in its Federal Reserve Bank account.
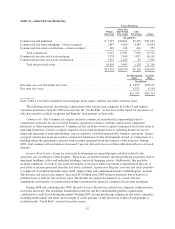
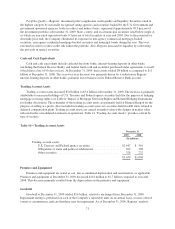
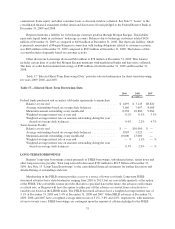
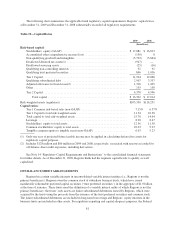
Trading Account Assets
Trading account assets increased $2.0 billion to $3.0 billion at December 31, 2009. The increase is primarily
attributable to increased holdings of U.S. Treasury and Federal agency securities held for the purpose of hedging
mortgage servicing rights (see Table 8 “Impact of Mortgage Servicing Rights and Related Hedging Instruments”
for further discussion). The remainder of the trading account assets are primarily held at Morgan Keegan for the
purpose of selling at a profit. Also included in trading account assets are securities held in rabbi trusts related to
deferred compensation plans. Trading account assets are carried at market value with changes in market value
reflected in the consolidated statements of operations. Table 14 “Trading Account Assets” provides a detail by
type of security.
Table 14—Trading Account Assets
December 31
2009 2008
(In millions)
Trading account assets:
U.S. Treasury and Federal agency securities .................. $2,447 $ 510
Obligations of states and political subdivisions ................ 264 308
Other securities ......................................... 328 232
$3,039 $1,050
Premises and Equipment
Premises and equipment are stated at cost, less accumulated depreciation and amortization, as applicable.
Premises and equipment at December 31, 2009 decreased $118 million to $2.7 billion compared to year-end
2008. This decrease primarily resulted from the depreciation on the premises and equipment.
Goodwill
Goodwill at December 31, 2009 totaled $5.6 billion, relatively unchanged from December 31, 2008.
Impairment testing is performed on each of the Company’s reportable units on an annual basis, or more often if
events or circumstances indicate that there may be impairment. As of December 31, 2009, Regions’ analysis
71