Regions Bank 2009 Annual Report Download - page 87
Download and view the complete annual report
Please find page 87 of the 2009 Regions Bank annual report below. You can navigate through the pages in the report by either clicking on the pages listed below, or by using the keyword search tool below to find specific information within the annual report.-
 1
1 -
2
-
3
-
4
-
5
-
6
-
7
-
8
-
9
-
10
-
11
-
12
-
13
-
14
-
15
-
16
-
17
-
18
-
19
-
20
-
21
-
22
-
23
-
24
-
25
-
26
-
27
-
28
-
29
-
30
-
31
-
32
-
33
-
34
-
35
-
36
-
37
-
38
-
39
-
40
-
41
-
42
-
43
-
44
-
45
-
46
-
47
-
48
-
49
-
50
-
51
-
52
-
53
-
54
-
55
-
56
-
57
-
58
-
59
-
60
-
61
-
62
-
63
-
64
-
65
-
66
-
67
-
68
-
69
-
70
-
71
-
72
-
73
-
74
-
75
-
76
-
 77
77 -
 78
78 -
 79
79 -
 80
80 -
 81
81 -
 82
82 -
 83
83 -
 84
84 -
 85
85 -
 86
86 -
 87
87 -
 88
88 -
 89
89 -
 90
90 -
 91
91 -
 92
92 -
 93
93 -
 94
94 -
 95
95 -
 96
96 -
 97
97 -
98
-
99
-
100
-
101
-
102
-
103
-
104
-
105
-
106
-
107
-
108
-
109
-
110
-
111
-
112
-
113
-
114
-
115
-
116
-
117
-
118
-
119
-
120
-
121
-
122
-
123
-
124
-
125
-
126
-
127
-
128
-
129
-
130
-
131
-
132
-
133
-
134
-
135
-
136
-
137
-
138
-
139
-
140
-
141
-
142
-
143
-
144
-
145
-
146
-
147
-
148
-
149
-
150
-
151
-
152
-
153
-
154
-
155
-
156
-
157
-
158
-
159
-
160
-
161
-
162
-
163
-
164
-
165
-
166
-
167
-
168
-
169
-
170
-
171
-
172
-
173
-
174
-
175
-
176
-
177
-
178
-
179
-
180
-
181
-
182
-
183
-
184
-
185
-
186
-
187
-
188
-
189
-
190
-
191
-
192
-
193
-
194
-
195
-
196
-
197
-
198
-
199
-
200
-
201
-
202
-
203
-
204
-
205
-
206
-
207
-
208
-
209
-
210
-
211
-
212
-
213
-
214
-
215
-
216
-
217
-
218
-
219
-
220
 |
 |

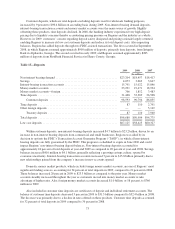
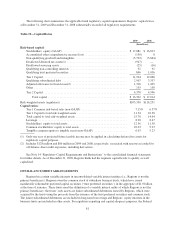
Customer deposits, which are total deposits excluding deposits used for wholesale funding purposes,
increased by 9 percent to $98.6 billion on an ending basis during 2009. Non-interest bearing demand deposits,
interest-bearing transaction accounts and money market accounts were the main source of growth. Slightly
offsetting these products, time deposits declined. In 2008, the banking industry experienced very high deposit
pricing due to liquidity concerns thereby accentuating pricing pressure on Regions and the industry as a whole.
However, in 2009, customers’ concern regarding deposit safety dissipated and pricing rationale largely returned,
enabling Regions to increase its low cost customer deposits and reduce its total deposit costs. Also impacting
balances, Regions has added deposits through two FDIC-assisted transactions. The first occurred in September
2008, in which Regions assumed approximately $900 million of deposits, primarily time deposits, from Integrity
Bank in Alpharetta, Georgia. The second occurred in early 2009, and Regions assumed approximately $285
million of deposits from FirstBank Financial Services in Henry County, Georgia.
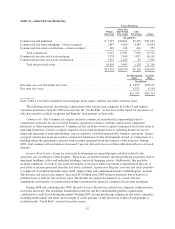
Table 15—Deposits
2009 2008 2007
(In millions)
Non-interest bearing demand .......................................... $23,204 $18,457 $18,417
Savings ........................................................... 4,073 3,663 3,647
Interest-bearing transaction accounts .................................... 15,791 15,022 15,846
Money market accounts .............................................. 23,291 19,471 18,934
Money market accounts—foreign ...................................... 766 1,812 3,483
Time deposits ...................................................... 31,468 32,369 26,508
Customer deposits .............................................. 98,593 90,794 86,835
Time deposits ...................................................... 87 110 2,791
Other foreign deposits ............................................... — — 5,149
Treasury deposits ............................................... 87 110 7,940
Total deposits ...................................................... $98,680 $90,904 $94,775
Low cost deposits ................................................... $67,125 $58,425 $60,327
Within customer deposits, non-interest-bearing deposits increased $4.7 billion to $23.2 billion, driven by an
increase in non-interest bearing deposits from commercial and small businesses. Regions was aided by its
decision to opt into the FDIC’s Transaction Account Guarantee Program (“TAGP”), in which all non-interest
bearing deposits are fully guaranteed by the FDIC. This program is scheduled to expire in June 2010 and could
impact Regions’ non-interest bearing deposit balances. Non-interest-bearing deposits accounted for
approximately 24 percent of total deposits at year-end 2009 as compared to 20 percent at year-end 2008. Savings
balances increased $410 million to $4.1 billion, generally reflecting a growing savings culture, spurred by
economic uncertainty. Interest-bearing transaction accounts increased 5 percent to $15.8 billion primarily due to
new relationships gained from the company’s increase in new accounts opened.
Domestic money market products, which exclude foreign money market accounts, are one of Regions’ most
significant funding sources, accounting for 24 percent of total deposits in 2009, compared to 21 percent in 2008.
These balances increased 20 percent in 2009 to $23.3 billion as compared to the prior year. Money market
accounts steadily increased throughout the year as customers moved into money market accounts to take
advantage of higher rates. Also, foreign money market accounts decreased $1.0 billion, or 58 percent, to $766
million in 2009.
Also included in customer time deposits are certificates of deposit and individual retirement accounts. The
balance of customer time deposits decreased 3 percent in 2009 to $31.5 billion compared to $32.4 billion in 2008.
The decrease was primarily due to a decline in rates offered on these products. Customer time deposits accounted
for 32 percent of total deposits in 2009 compared to 36 percent in 2008.
73