Regions Bank 2009 Annual Report Download - page 123
Download and view the complete annual report
Please find page 123 of the 2009 Regions Bank annual report below. You can navigate through the pages in the report by either clicking on the pages listed below, or by using the keyword search tool below to find specific information within the annual report.-
 1
1 -
2
-
3
-
4
-
5
-
6
-
7
-
8
-
9
-
10
-
11
-
12
-
13
-
14
-
15
-
16
-
17
-
18
-
19
-
20
-
21
-
22
-
23
-
24
-
25
-
26
-
27
-
28
-
29
-
30
-
31
-
32
-
33
-
34
-
35
-
36
-
37
-
38
-
39
-
40
-
41
-
42
-
43
-
44
-
45
-
46
-
47
-
48
-
49
-
50
-
51
-
52
-
53
-
54
-
55
-
56
-
57
-
58
-
59
-
60
-
61
-
62
-
63
-
64
-
65
-
66
-
67
-
68
-
69
-
70
-
71
-
72
-
73
-
74
-
75
-
76
-
77
-
78
-
79
-
80
-
81
-
82
-
83
-
84
-
85
-
86
-
87
-
88
-
89
-
90
-
91
-
92
-
93
-
94
-
95
-
96
-
97
-
98
-
99
-
100
-
101
-
102
-
103
-
104
-
105
-
106
-
107
-
108
-
109
-
110
-
111
-
112
-
 113
113 -
 114
114 -
 115
115 -
 116
116 -
 117
117 -
 118
118 -
 119
119 -
 120
120 -
 121
121 -
 122
122 -
 123
123 -
 124
124 -
 125
125 -
 126
126 -
 127
127 -
 128
128 -
 129
129 -
 130
130 -
 131
131 -
 132
132 -
 133
133 -
134
-
135
-
136
-
137
-
138
-
139
-
140
-
141
-
142
-
143
-
144
-
145
-
146
-
147
-
148
-
149
-
150
-
151
-
152
-
153
-
154
-
155
-
156
-
157
-
158
-
159
-
160
-
161
-
162
-
163
-
164
-
165
-
166
-
167
-
168
-
169
-
170
-
171
-
172
-
173
-
174
-
175
-
176
-
177
-
178
-
179
-
180
-
181
-
182
-
183
-
184
-
185
-
186
-
187
-
188
-
189
-
190
-
191
-
192
-
193
-
194
-
195
-
196
-
197
-
198
-
199
-
200
-
201
-
202
-
203
-
204
-
205
-
206
-
207
-
208
-
209
-
210
-
211
-
212
-
213
-
214
-
215
-
216
-
217
-
218
-
219
-
220
 |
 |

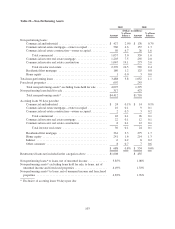
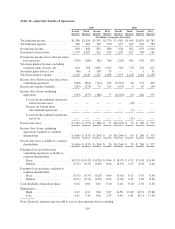
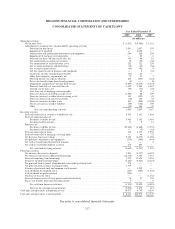
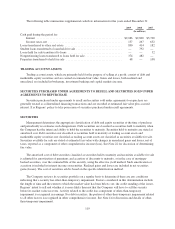
Table 30—Quarterly Results of Operations
2009 2008
Fourth
Quarter
Third
Quarter
Second
Quarter
First
Quarter
Fourth
Quarter
Third
Quarter
Second
Quarter
First
Quarter
(In millions, except per share data)
Total interest income ................ $1,288 $1,314 $1,351 $1,379 $ 1,581 $1,569 $1,630 $1,783
Total interest expense ............... 438 469 520 570 657 647 651 765
Net interest income ................. 850 845 831 809 924 922 979 1,018
Provision for loan losses ............. 1,179 1,025 912 425 1,150 417 309 181
Net interest income (loss) after provision
for loan losses ................... (329) (180) (81) 384 (226) 505 670 837
Total non-interest income, excluding
securities gains (losses), net ........ 814 768 1,091 1,013 702 719 743 817
Securities gains (losses), net .......... (96) 4 108 53 — — 1 91
Total non-interest expense ........... 1,219 1,243 1,231 1,058 7,273 1,128 1,141 1,250
Income (loss) before income taxes from
continuing operations ............. (830) (651) (113) 392 (6,797) 96 273 495
Income tax expense (benefit) ......... (287) (274) 75 315 (579) 6 67 158
Income (loss) from continuing
operations ...................... (543) (377) (188) 77 (6,218) 90 206 337
Loss from discontinued operations
before income taxes .......... ———— — (18) — —
Income tax benefit from
discontinued operations ........ ———— — (7)——
Loss from discontinued operations,
netoftax ................... ———— — (11) — —
Net income (loss) .................. $ (543) $ (377) $ (188) $ 77 $(6,218) $ 79 $ 206 $ 337
Income (loss) from continuing
operations available to common
shareholders .................... $ (606) $ (437) $ (244) $ 26 $(6,244) $ 90 $ 206 $ 337
Net income (loss) available to common
shareholders .................... $ (606) $ (437) $ (244) $ 26 $(6,244) $ 79 $ 206 $ 337
Earnings (loss) per share from
continuing operations available to
common shareholders:
Basic ........................ $(0.51) $ (0.37) $ (0.28) $ 0.04 $ (8.97) $ 0.13 $ 0.30 $ 0.48
Diluted ....................... (0.51) (0.37) (0.28) 0.04 (8.97) 0.13 0.30 0.48
Earnings (loss) per share available to
common shareholders:
Basic ........................ (0.51) (0.37) (0.28) 0.04 (9.01) 0.11 0.30 0.48
Diluted ....................... (0.51) (0.37) (0.28) 0.04 (9.01) 0.11 0.30 0.48
Cash dividends declared per share ..... 0.01 0.01 0.01 0.10 0.10 0.10 0.38 0.38
Market price:
High ......................... 6.29 6.91 7.60 9.07 14.50 19.80 24.31 25.84
Low ......................... 4.61 3.30 3.66 2.35 6.85 6.41 10.31 17.90
Note: Quarterly amounts may not add to year-to-date amounts due to rounding.
109