Regions Bank 2009 Annual Report Download - page 75
Download and view the complete annual report
Please find page 75 of the 2009 Regions Bank annual report below. You can navigate through the pages in the report by either clicking on the pages listed below, or by using the keyword search tool below to find specific information within the annual report.-
 1
1 -
2
-
3
-
4
-
5
-
6
-
7
-
8
-
9
-
10
-
11
-
12
-
13
-
14
-
15
-
16
-
17
-
18
-
19
-
20
-
21
-
22
-
23
-
24
-
25
-
26
-
27
-
28
-
29
-
30
-
31
-
32
-
33
-
34
-
35
-
36
-
37
-
38
-
39
-
40
-
41
-
42
-
43
-
44
-
45
-
46
-
47
-
48
-
49
-
50
-
51
-
52
-
53
-
54
-
55
-
56
-
57
-
58
-
59
-
60
-
61
-
62
-
63
-
64
-
 65
65 -
 66
66 -
 67
67 -
 68
68 -
 69
69 -
 70
70 -
 71
71 -
 72
72 -
 73
73 -
 74
74 -
 75
75 -
 76
76 -
 77
77 -
 78
78 -
 79
79 -
 80
80 -
 81
81 -
 82
82 -
 83
83 -
 84
84 -
 85
85 -
86
-
87
-
88
-
89
-
90
-
91
-
92
-
93
-
94
-
95
-
96
-
97
-
98
-
99
-
100
-
101
-
102
-
103
-
104
-
105
-
106
-
107
-
108
-
109
-
110
-
111
-
112
-
113
-
114
-
115
-
116
-
117
-
118
-
119
-
120
-
121
-
122
-
123
-
124
-
125
-
126
-
127
-
128
-
129
-
130
-
131
-
132
-
133
-
134
-
135
-
136
-
137
-
138
-
139
-
140
-
141
-
142
-
143
-
144
-
145
-
146
-
147
-
148
-
149
-
150
-
151
-
152
-
153
-
154
-
155
-
156
-
157
-
158
-
159
-
160
-
161
-
162
-
163
-
164
-
165
-
166
-
167
-
168
-
169
-
170
-
171
-
172
-
173
-
174
-
175
-
176
-
177
-
178
-
179
-
180
-
181
-
182
-
183
-
184
-
185
-
186
-
187
-
188
-
189
-
190
-
191
-
192
-
193
-
194
-
195
-
196
-
197
-
198
-
199
-
200
-
201
-
202
-
203
-
204
-
205
-
206
-
207
-
208
-
209
-
210
-
211
-
212
-
213
-
214
-
215
-
216
-
217
-
218
-
219
-
220
 |
 |

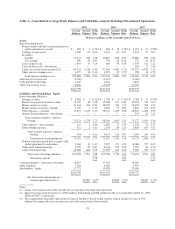
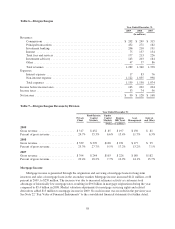
Table 9—Non-Interest Expense (including Non-GAAP reconciliation)
As Reported (GAAP)
2009 2008 2007
(In millions)
Salaries and employee benefits ................................... $2,269 $ 2,356 $2,472
Net occupancy expense ......................................... 454 442 414
Furniture and equipment expense ................................. 311 335 301
Professional and legal fees ....................................... 309 214 152
Amortization of core deposit intangibles ............................ 120 134 155
Other real estate owned expense .................................. 175 103 16
Marketing .................................................... 75 97 134
Goodwill impairment ........................................... — 6,000 —
Other-than-temporary impairments ................................ 75 23 7
Mortgage servicing rights impairment .............................. — 85 6
FDIC special assessment ........................................ 64 — —
FDIC premiums ............................................... 163 15 11
Other miscellaneous expenses .................................... 736 988 992
$4,751 $10,792 $4,660
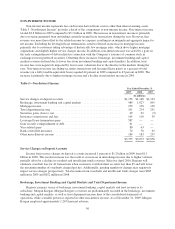
Merger-Related Charges and
Goodwill Impairment
2009 2008 2007
(In millions)
Salaries and employee benefits ................................... $ — $ 134 $ 159
Net occupancy expense ......................................... — 4 34
Furniture and equipment expense ................................. — 5 5
Professional and legal fees ....................................... — 7 34
Amortization of core deposit intangibles ............................ — — —
Other real estate owned expense .................................. — — —
Marketing .................................................... — 13 43
Goodwill impairment ........................................... — 6,000 —
Other-than-temporary impairments ................................ — — —
Mortgage servicing rights impairment .............................. — — —
FDIC special assessment ........................................ — — —
FDIC premiums ............................................... — — —
Other miscellaneous expenses .................................... — 38 76
$ — $ 6,201 $ 351
As Adjusted (Non-GAAP)
2009 2008 2007
(In millions)
Salaries and employee benefits ................................... $2,269 $ 2,222 $2,313
Net occupancy expense ......................................... 454 438 380
Furniture and equipment expense ................................. 311 330 296
Professional and legal fees ....................................... 309 207 118
Amortization of core deposit intangibles ............................ 120 134 155
Other real estate owned expense .................................. 175 103 16
Marketing .................................................... 75 84 91
Other-than-temporary impairments ................................ 75 23 7
Mortgage servicing rights impairment .............................. — 85 6
FDIC special assessment ........................................ 64 — —
FDIC premiums ............................................... 163 15 11
Other miscellaneous expenses .................................... 736 950 916
$4,751 $ 4,591 $4,309
61