Regions Bank 2009 Annual Report Download - page 122
Download and view the complete annual report
Please find page 122 of the 2009 Regions Bank annual report below. You can navigate through the pages in the report by either clicking on the pages listed below, or by using the keyword search tool below to find specific information within the annual report.-
 1
1 -
2
-
3
-
4
-
5
-
6
-
7
-
8
-
9
-
10
-
11
-
12
-
13
-
14
-
15
-
16
-
17
-
18
-
19
-
20
-
21
-
22
-
23
-
24
-
25
-
26
-
27
-
28
-
29
-
30
-
31
-
32
-
33
-
34
-
35
-
36
-
37
-
38
-
39
-
40
-
41
-
42
-
43
-
44
-
45
-
46
-
47
-
48
-
49
-
50
-
51
-
52
-
53
-
54
-
55
-
56
-
57
-
58
-
59
-
60
-
61
-
62
-
63
-
64
-
65
-
66
-
67
-
68
-
69
-
70
-
71
-
72
-
73
-
74
-
75
-
76
-
77
-
78
-
79
-
80
-
81
-
82
-
83
-
84
-
85
-
86
-
87
-
88
-
89
-
90
-
91
-
92
-
93
-
94
-
95
-
96
-
97
-
98
-
99
-
100
-
101
-
102
-
103
-
104
-
105
-
106
-
107
-
108
-
109
-
110
-
111
-
 112
112 -
 113
113 -
 114
114 -
 115
115 -
 116
116 -
 117
117 -
 118
118 -
 119
119 -
 120
120 -
 121
121 -
 122
122 -
 123
123 -
 124
124 -
 125
125 -
 126
126 -
 127
127 -
 128
128 -
 129
129 -
 130
130 -
 131
131 -
 132
132 -
133
-
134
-
135
-
136
-
137
-
138
-
139
-
140
-
141
-
142
-
143
-
144
-
145
-
146
-
147
-
148
-
149
-
150
-
151
-
152
-
153
-
154
-
155
-
156
-
157
-
158
-
159
-
160
-
161
-
162
-
163
-
164
-
165
-
166
-
167
-
168
-
169
-
170
-
171
-
172
-
173
-
174
-
175
-
176
-
177
-
178
-
179
-
180
-
181
-
182
-
183
-
184
-
185
-
186
-
187
-
188
-
189
-
190
-
191
-
192
-
193
-
194
-
195
-
196
-
197
-
198
-
199
-
200
-
201
-
202
-
203
-
204
-
205
-
206
-
207
-
208
-
209
-
210
-
211
-
212
-
213
-
214
-
215
-
216
-
217
-
218
-
219
-
220
 |
 |
Mortgage servicing rights impairment increased $79 million to $85 million in 2008. The increase was driven
by the effects of changes in the interest rate environment.
FDIC premiums increased $4 million to $15 million in 2008. The increase was driven by a higher insured
deposit base.
Other miscellaneous expenses remained relatively steady, decreasing $4 million to $988 million in 2008;
however, excluding merger charges of $38 million in 2008 and $76 million in 2007, other miscellaneous
expenses increased 4 percent. Included in other miscellaneous expenses were $49 million and $39 million in
write-downs on the investment in two Morgan Keegan mutual funds during 2008 and 2007, respectively. Also in
2008, Regions incurred a $65 million loss on early extinguishment of debt related to the redemption of
subordinated notes. Other miscellaneous expenses benefited from the recognition of a $28 million litigation
expense reduction related to Visa’s IPO in early 2008. Regions had recorded a $52 million expense for Visa
litigation in 2007.
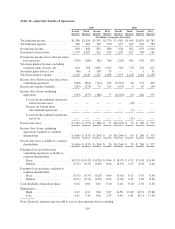
Regions’ 2008 provision for income taxes from continuing operations decreased $994 million to a tax
benefit of $348 million compared to expense of $646 million in 2007, primarily due to lower consolidated
earnings combined with a $275 million benefit from settlement of uncertain tax positions resulting from
resolution with the IRS of the Company’s federal uncertain tax positions for tax years 1999-2006. Therefore,
Regions’ effective tax rate from continuing operations was 5.9 percent in 2008 compared to 31.7 percent in 2007.
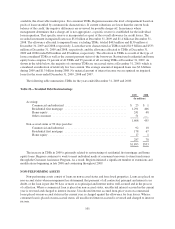
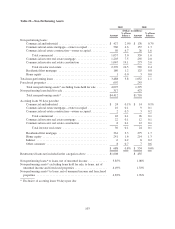
At December 31, 2008, non-performing assets totaled $1.7 billion, or 1.76 percent of ending loans,
compared to $864 million, or 0.90 percent of loans, at December 31, 2007. Non-performing assets, excluding
loans held for sale, increased $431 million to $1.3 billion, or 1.33 percent, compared to $864 million, or 0.90
percent in 2007. The increase in non-performing assets was primarily driven by construction and commercial real
estate loans, including the residential homebuilder portfolio, due to the widespread decline in residential property
values. During 2008, Regions disposed of or designated as held for sale approximately $1.6 billion of loans and
foreclosed properties, partially offsetting the otherwise higher level of non-performing assets.
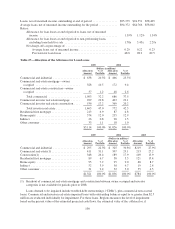
During 2008, the provision for loan losses from continuing operations was $2.1 billion and net charge-offs
were $1.5 billion. This compares to a provision for loan losses from continuing operations of $555 million and
net charge-offs of $271 million in 2007. Net charge-offs as a percent of average loans were 1.59 percent in 2008
compared to 0.29 percent in 2007. The significant increase in the provision and net charge-offs in 2008 is related
to losses on non-performing loans sold or moved to held for sale. In 2008, these losses accounted for $639
million of the increase in the net charge-offs. The remaining increase in the loan loss provision was primarily due
to an increase in management’s estimate of losses inherent in its residential homebuilder, condominium, home
equity and residential mortgage portfolios, all of which are closely tied to the housing market slowdown. Losses
were also impacted by the disposition of problem loans, as well as generally weaker economic conditions in the
broader economy.
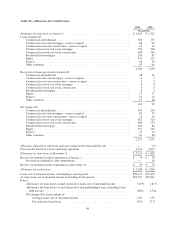
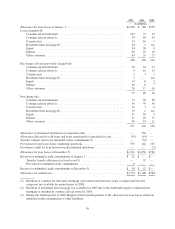
At December 31, 2008, the allowance for credit losses totaled $1.9 billion or 1.95 percent of total loans, net
of unearned income compared to $1.4 billion or 1.45 percent at year-end 2007. The increase in the allowance for
credit loss ratio reflects management’s estimate of the level of inherent losses in the portfolio, which
management believes increased during 2008 due to a slowing economy and a weakening housing market. The
increase in non-performing assets, driven largely by residential homebuilder and condominium loans, was a key
determining dynamic in the assessment of inherent losses and, as a result, was an important factor in determining
the allowance level. Deterioration of the Company’s home equity and residential first mortgage portfolios,
especially Florida-based credits, was also a factor.
108