Regions Bank 2009 Annual Report Download - page 156
Download and view the complete annual report
Please find page 156 of the 2009 Regions Bank annual report below. You can navigate through the pages in the report by either clicking on the pages listed below, or by using the keyword search tool below to find specific information within the annual report.-
 1
1 -
2
-
3
-
4
-
5
-
6
-
7
-
8
-
9
-
10
-
11
-
12
-
13
-
14
-
15
-
16
-
17
-
18
-
19
-
20
-
21
-
22
-
23
-
24
-
25
-
26
-
27
-
28
-
29
-
30
-
31
-
32
-
33
-
34
-
35
-
36
-
37
-
38
-
39
-
40
-
41
-
42
-
43
-
44
-
45
-
46
-
47
-
48
-
49
-
50
-
51
-
52
-
53
-
54
-
55
-
56
-
57
-
58
-
59
-
60
-
61
-
62
-
63
-
64
-
65
-
66
-
67
-
68
-
69
-
70
-
71
-
72
-
73
-
74
-
75
-
76
-
77
-
78
-
79
-
80
-
81
-
82
-
83
-
84
-
85
-
86
-
87
-
88
-
89
-
90
-
91
-
92
-
93
-
94
-
95
-
96
-
97
-
98
-
99
-
100
-
101
-
102
-
103
-
104
-
105
-
106
-
107
-
108
-
109
-
110
-
111
-
112
-
113
-
114
-
115
-
116
-
117
-
118
-
119
-
120
-
121
-
122
-
123
-
124
-
125
-
126
-
127
-
128
-
129
-
130
-
131
-
132
-
133
-
134
-
135
-
136
-
137
-
138
-
139
-
140
-
141
-
142
-
143
-
144
-
145
-
 146
146 -
 147
147 -
 148
148 -
 149
149 -
 150
150 -
 151
151 -
 152
152 -
 153
153 -
 154
154 -
 155
155 -
 156
156 -
 157
157 -
 158
158 -
 159
159 -
 160
160 -
 161
161 -
 162
162 -
 163
163 -
 164
164 -
 165
165 -
 166
166 -
167
-
168
-
169
-
170
-
171
-
172
-
173
-
174
-
175
-
176
-
177
-
178
-
179
-
180
-
181
-
182
-
183
-
184
-
185
-
186
-
187
-
188
-
189
-
190
-
191
-
192
-
193
-
194
-
195
-
196
-
197
-
198
-
199
-
200
-
201
-
202
-
203
-
204
-
205
-
206
-
207
-
208
-
209
-
210
-
211
-
212
-
213
-
214
-
215
-
216
-
217
-
218
-
219
-
220
 |
 |

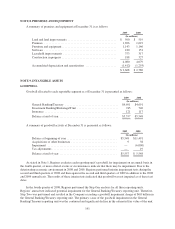
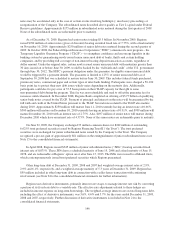
This was evidenced by rapid deterioration in credit costs, continued compression of the net interest margin, costs
of the preferred stock issuance to the U.S. Treasury and continued declines in the Company’s overall market
capitalization during the fourth quarter of 2008. The Step One analysis did not indicate that goodwill was
impaired for the Investment Banking/Brokerage/Trust and Insurance reporting units as of December 31, 2008.
The $6.0 billion impairment charge discussed above was Regions’ first recorded goodwill impairment.
There has been no impairment recorded subsequent to this time. Accordingly, the cumulative impairment at
December 31, 2008 and 2009 was $6.0 billion.
In the fourth quarter of 2009, Regions performed the Step One analysis for all three reporting units. This
annual test indicated potential impairment for the General Banking/Treasury reporting unit. Based on the results
of the Step Two analysis performed, Regions concluded the General Banking/Treasury reporting unit’s goodwill
was not impaired. The Step One analysis did not indicate that goodwill was impaired for the Investment Banking/
Brokerage/Trust and Insurance reporting units as of December 31, 2009.
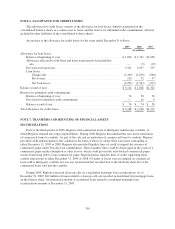
The valuation methodologies of certain material financial assets and liabilities are discussed in Note 22,
“Fair Value of Financial Instruments.”
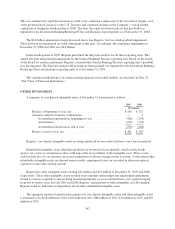
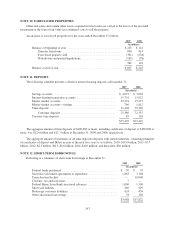
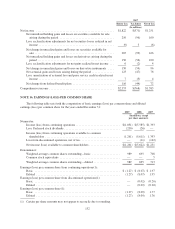
OTHER INTANGIBLES
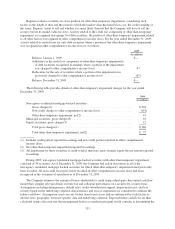
A summary of core deposit intangible assets at December 31 is presented as follows:
2009 2008
(In millions)
Balance at beginning of year, net ................................. $583 $715
Amounts related to business combinations ......................... — 2
Accumulated amortization, beginning of year ................... (428) (294)
Amortization ............................................. (122) (134)
Accumulated amortization, end of year ........................ (550) (428)
Balance at end of year, net ...................................... $461 $583
Regions’ core deposit intangible assets are being amortized on an accelerated basis over a ten-year period.
Identifiable intangible assets other than goodwill are reviewed at least annually, usually in the fourth
quarter, for events or circumstances that could impact the recoverability of the intangible asset. These events
could include loss of core deposits, increased competition or adverse changes in the economy. To the extent other
identifiable intangible assets are deemed unrecoverable, impairment losses are recorded in other non-interest
expense to reduce the carrying amount.
Regions has other intangible assets totaling $42 million and $55 million at December 31, 2009 and 2008,
respectively. These other intangible assets resulted from customer relationships and employment agreements
related to various acquisitions and are being amortized primarily on an accelerated basis over a period ranging
from two to twelve years. In both 2009 and 2008, Regions’ amortization of other intangibles was $16 million.
Regions noted no indicators of impairment for all other identifiable intangible assets.
The aggregate amount of amortization expense for core deposit intangible assets and other intangible assets
is estimated to be $118 million in 2010, $105 million in 2011, $88 million in 2012, $74 million in 2013, and $61
million in 2014.
142