Regions Bank 2009 Annual Report Download - page 196
Download and view the complete annual report
Please find page 196 of the 2009 Regions Bank annual report below. You can navigate through the pages in the report by either clicking on the pages listed below, or by using the keyword search tool below to find specific information within the annual report.-
 1
1 -
2
-
3
-
4
-
5
-
6
-
7
-
8
-
9
-
10
-
11
-
12
-
13
-
14
-
15
-
16
-
17
-
18
-
19
-
20
-
21
-
22
-
23
-
24
-
25
-
26
-
27
-
28
-
29
-
30
-
31
-
32
-
33
-
34
-
35
-
36
-
37
-
38
-
39
-
40
-
41
-
42
-
43
-
44
-
45
-
46
-
47
-
48
-
49
-
50
-
51
-
52
-
53
-
54
-
55
-
56
-
57
-
58
-
59
-
60
-
61
-
62
-
63
-
64
-
65
-
66
-
67
-
68
-
69
-
70
-
71
-
72
-
73
-
74
-
75
-
76
-
77
-
78
-
79
-
80
-
81
-
82
-
83
-
84
-
85
-
86
-
87
-
88
-
89
-
90
-
91
-
92
-
93
-
94
-
95
-
96
-
97
-
98
-
99
-
100
-
101
-
102
-
103
-
104
-
105
-
106
-
107
-
108
-
109
-
110
-
111
-
112
-
113
-
114
-
115
-
116
-
117
-
118
-
119
-
120
-
121
-
122
-
123
-
124
-
125
-
126
-
127
-
128
-
129
-
130
-
131
-
132
-
133
-
134
-
135
-
136
-
137
-
138
-
139
-
140
-
141
-
142
-
143
-
144
-
145
-
146
-
147
-
148
-
149
-
150
-
151
-
152
-
153
-
154
-
155
-
156
-
157
-
158
-
159
-
160
-
161
-
162
-
163
-
164
-
165
-
166
-
167
-
168
-
169
-
170
-
171
-
172
-
173
-
174
-
175
-
176
-
177
-
178
-
179
-
180
-
181
-
182
-
183
-
184
-
185
-
 186
186 -
 187
187 -
 188
188 -
 189
189 -
 190
190 -
 191
191 -
 192
192 -
 193
193 -
 194
194 -
 195
195 -
 196
196 -
 197
197 -
 198
198 -
 199
199 -
 200
200 -
 201
201 -
 202
202 -
 203
203 -
 204
204 -
 205
205 -
 206
206 -
207
-
208
-
209
-
210
-
211
-
212
-
213
-
214
-
215
-
216
-
217
-
218
-
219
-
220
 |
 |

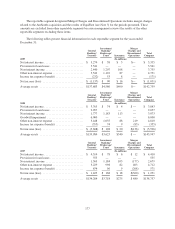
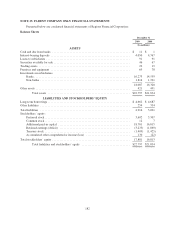
NOTE 25. PARENT COMPANY ONLY FINANCIAL STATEMENTS
Presented below are condensed financial statements of Regions Financial Corporation:
Balance Sheets
December 31
2009 2008
(In millions)
ASSETS
Cash and due from banks ..................................................... $ 11 $ 1
Interest-bearing deposits ...................................................... 4,050 4,767
Loans to subsidiaries ......................................................... 91 91
Securities available for sale .................................................... 46 67
Trading assets .............................................................. 22 19
Premises and equipment ...................................................... 69 78
Investments in subsidiaries:
Banks ................................................................. 16,273 14,559
Non-banks ............................................................. 1,814 1,761
18,087 16,320
Other assets ................................................................ 421 491
Total assets ........................................................ $22,797 $21,834
LIABILITIES AND STOCKHOLDERS’ EQUITY
Long-term borrowings ........................................................ $ 4,662 $ 4,687
Other liabilities ............................................................. 254 334
Total liabilities ............................................................. 4,916 5,021
Stockholders’ equity:
Preferred stock .......................................................... 3,602 3,307
Common stock .......................................................... 12 7
Additional paid-in capital ................................................. 18,781 16,815
Retained earnings (deficit) ................................................ (3,235) (1,869)
Treasury stock .......................................................... (1,409) (1,425)
Accumulated other comprehensive income (loss) .............................. 130 (22)
Total stockholders’ equity ..................................................... 17,881 16,813
Total liabilities and stockholders’ equity ................................. $22,797 $21,834
182