Regions Bank 2009 Annual Report Download - page 185
Download and view the complete annual report
Please find page 185 of the 2009 Regions Bank annual report below. You can navigate through the pages in the report by either clicking on the pages listed below, or by using the keyword search tool below to find specific information within the annual report.-
 1
1 -
2
-
3
-
4
-
5
-
6
-
7
-
8
-
9
-
10
-
11
-
12
-
13
-
14
-
15
-
16
-
17
-
18
-
19
-
20
-
21
-
22
-
23
-
24
-
25
-
26
-
27
-
28
-
29
-
30
-
31
-
32
-
33
-
34
-
35
-
36
-
37
-
38
-
39
-
40
-
41
-
42
-
43
-
44
-
45
-
46
-
47
-
48
-
49
-
50
-
51
-
52
-
53
-
54
-
55
-
56
-
57
-
58
-
59
-
60
-
61
-
62
-
63
-
64
-
65
-
66
-
67
-
68
-
69
-
70
-
71
-
72
-
73
-
74
-
75
-
76
-
77
-
78
-
79
-
80
-
81
-
82
-
83
-
84
-
85
-
86
-
87
-
88
-
89
-
90
-
91
-
92
-
93
-
94
-
95
-
96
-
97
-
98
-
99
-
100
-
101
-
102
-
103
-
104
-
105
-
106
-
107
-
108
-
109
-
110
-
111
-
112
-
113
-
114
-
115
-
116
-
117
-
118
-
119
-
120
-
121
-
122
-
123
-
124
-
125
-
126
-
127
-
128
-
129
-
130
-
131
-
132
-
133
-
134
-
135
-
136
-
137
-
138
-
139
-
140
-
141
-
142
-
143
-
144
-
145
-
146
-
147
-
148
-
149
-
150
-
151
-
152
-
153
-
154
-
155
-
156
-
157
-
158
-
159
-
160
-
161
-
162
-
163
-
164
-
165
-
166
-
167
-
168
-
169
-
170
-
171
-
172
-
173
-
174
-
 175
175 -
 176
176 -
 177
177 -
 178
178 -
 179
179 -
 180
180 -
 181
181 -
 182
182 -
 183
183 -
 184
184 -
 185
185 -
 186
186 -
 187
187 -
 188
188 -
 189
189 -
 190
190 -
 191
191 -
 192
192 -
 193
193 -
 194
194 -
 195
195 -
196
-
197
-
198
-
199
-
200
-
201
-
202
-
203
-
204
-
205
-
206
-
207
-
208
-
209
-
210
-
211
-
212
-
213
-
214
-
215
-
216
-
217
-
218
-
219
-
220
 |
 |

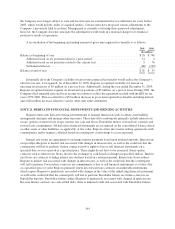
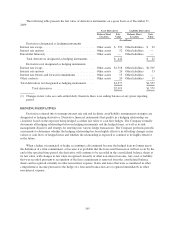
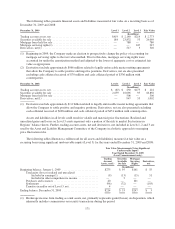
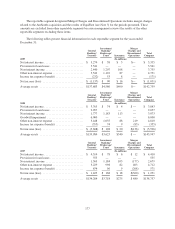
The following tables presents financial assets and liabilities measured at fair value on a recurring basis as of
December 31, 2009 and 2008:
December 31, 2009 Level 1 Level 2 Level 3 Fair Value
(In millions)
Trading account assets, net ......................................... $419 $ 2,140 $214 $ 2,773
Securities available for sale ........................................ 184 23,832 53 24,069
Mortgage loans held for sale ........................................ — 780 — 780
Mortgage servicing rights(1) ....................................... — — 247 247
Derivatives, net(2) ............................................... — 517 3 520
(1) Beginning in 2009, the Company made an election to prospectively change the policy of accounting for
mortgage servicing rights to the fair value method. Prior to this date, mortgage servicing rights were
accounted for under the amortization method and adjusted to the lower of aggregate cost or estimated fair
value as appropriate.
(2) Derivatives include approximately $966 million related to legally enforceable master netting agreements
that allow the Company to settle positive and negative positions. Derivatives, net are also presented
excluding cash collateral received of $70 million and cash collateral posted of $336 million with
counterparties.
December 31, 2008 Level 1 Level 2 Level 3 Fair Value
(In millions)
Trading account assets, net ......................................... $ (83) $ 230 $275 $ 422
Securities available for sale ........................................ 2,659 16,096 95 18,850
Mortgage loans held for sale ....................................... — 506 — 506
Derivatives, net(1) ............................................... — 947 55 1,002
(1) Derivatives include approximately $1.6 billion related to legally enforceable master netting agreements that
allow the Company to settle positive and negative positions. Derivatives, net are also presented excluding
cash collateral received of $108 million and cash collateral posted of $451 million with counterparties.
Assets and liabilities in all levels could result in volatile and material price fluctuations. Realized and
unrealized gains and losses on Level 3 assets represent only a portion of the risk to market fluctuations in
Regions’ balance sheets. Further, trading account assets, net and derivatives, net included in Levels 1, 2 and 3 are
used by the Asset and Liability Management Committee of the Company in a holistic approach to managing
price fluctuation risks.
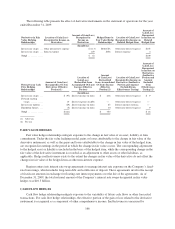
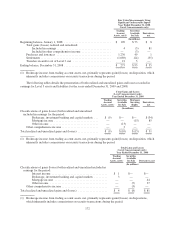
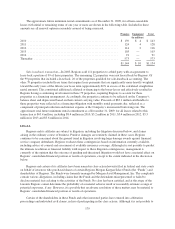
The following tables illustrates a rollforward for all assets and (liabilities) measured at fair value on a
recurring basis using significant unobservable inputs (Level 3) for the years ended December 31, 2009 and 2008:
Fair Value Measurements Using Significant
Unobservable Inputs
Year Ended December 31, 2009
(Level 3 measurements only)
Trading
Account
Assets, net(1)
Securities
Available
for Sale
Mortgage
Servicing
Rights
Derivatives,
net
(In millions)
Beginning balance, January 1, 2009 .......................... $275 $ 95 $161 $ 55
Total gains (losses) realized and unrealized:
Included in earnings(1) ............................ (9) (13) (15) 51
Included in other comprehensive income .............. — 3 — —
Purchases and issuances ................................ 40 — 101 —
Settlements .......................................... (96) (32) — (103)
Transfers in and/or out of Level 3, net ..................... 4 — — —
Ending balance, December 31, 2009 .......................... $214 $ 53 $247 $ 3
(1) Brokerage income from trading account assets, net, primarily represents gains/(losses) on disposition, which
inherently includes commissions on security transactions during the period.
171