Regions Bank 2009 Annual Report Download - page 171
Download and view the complete annual report
Please find page 171 of the 2009 Regions Bank annual report below. You can navigate through the pages in the report by either clicking on the pages listed below, or by using the keyword search tool below to find specific information within the annual report.-
 1
1 -
2
-
3
-
4
-
5
-
6
-
7
-
8
-
9
-
10
-
11
-
12
-
13
-
14
-
15
-
16
-
17
-
18
-
19
-
20
-
21
-
22
-
23
-
24
-
25
-
26
-
27
-
28
-
29
-
30
-
31
-
32
-
33
-
34
-
35
-
36
-
37
-
38
-
39
-
40
-
41
-
42
-
43
-
44
-
45
-
46
-
47
-
48
-
49
-
50
-
51
-
52
-
53
-
54
-
55
-
56
-
57
-
58
-
59
-
60
-
61
-
62
-
63
-
64
-
65
-
66
-
67
-
68
-
69
-
70
-
71
-
72
-
73
-
74
-
75
-
76
-
77
-
78
-
79
-
80
-
81
-
82
-
83
-
84
-
85
-
86
-
87
-
88
-
89
-
90
-
91
-
92
-
93
-
94
-
95
-
96
-
97
-
98
-
99
-
100
-
101
-
102
-
103
-
104
-
105
-
106
-
107
-
108
-
109
-
110
-
111
-
112
-
113
-
114
-
115
-
116
-
117
-
118
-
119
-
120
-
121
-
122
-
123
-
124
-
125
-
126
-
127
-
128
-
129
-
130
-
131
-
132
-
133
-
134
-
135
-
136
-
137
-
138
-
139
-
140
-
141
-
142
-
143
-
144
-
145
-
146
-
147
-
148
-
149
-
150
-
151
-
152
-
153
-
154
-
155
-
156
-
157
-
158
-
159
-
160
-
 161
161 -
 162
162 -
 163
163 -
 164
164 -
 165
165 -
 166
166 -
 167
167 -
 168
168 -
 169
169 -
 170
170 -
 171
171 -
 172
172 -
 173
173 -
 174
174 -
 175
175 -
 176
176 -
 177
177 -
 178
178 -
 179
179 -
 180
180 -
 181
181 -
182
-
183
-
184
-
185
-
186
-
187
-
188
-
189
-
190
-
191
-
192
-
193
-
194
-
195
-
196
-
197
-
198
-
199
-
200
-
201
-
202
-
203
-
204
-
205
-
206
-
207
-
208
-
209
-
210
-
211
-
212
-
213
-
214
-
215
-
216
-
217
-
218
-
219
-
220
 |
 |

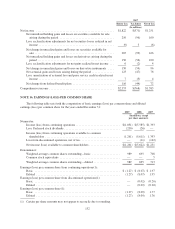
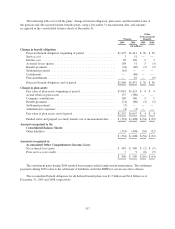
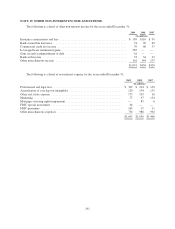
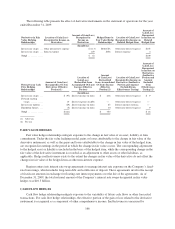
The following table sets forth the plans’ change in benefit obligation, plan assets and the funded status of
the pension and other postretirement benefits plans, using a December 31 measurement date, and amounts
recognized in the consolidated balance sheets at December 31:
Pension
Other
Postretirement
Benefits
2009 2008 2009 2008
(In millions)
Change in benefit obligation
Projected benefit obligation, beginning of period ..................... $1,475 $1,414 $ 36 $ 50
Service cost .................................................. 3 51 — —
Interest cost .................................................. 90 109 2 3
Actuarial losses (gains) ......................................... 108 31 3 (3)
Benefit payments .............................................. (74) (80) (3) (5)
Settlement payment ............................................ (16) — — —
Curtailments ................................................. — (60) — —
Plan amendments .............................................. — 10 — (9)
Projected benefit obligation, end of period .......................... $1,586 $1,475 $ 38 $ 36
Change in plan assets
Fair value of plan assets, beginning of period ........................ $1,067 $1,424$4$4
Actual return on plan assets ..................................... 157 (380) — —
Company contributions ......................................... 109 106 3 5
Benefit payments .............................................. (74) (80) (3) (5)
Settlement payment ............................................ (3) — — —
Administrative expenses ........................................ (4) (3) — —
Fair value of plan assets, end of period ............................. $1,252 $1,067$4$4
Funded status and prepaid (accrued) benefit cost at measurement date .... $ (334) $ (408) $ (34) $ (32)
Amount recognized in the
Consolidated Balance Sheets:
Other liabilities ............................................... (334) (408) (34) (32)
$ (334) $ (408) $ (34) $ (32)
Amounts recognized in
Accumulated Other Comprehensive Income (Loss):
Net actuarial loss (gain) ........................................ $ 483 $ 500 $ (2) $ (5)
Prior service cost (credit) ....................................... 7 9 (8) (9)
$ 490 $ 509 $ (10) $ (14)
The curtailment gains during 2008 resulted from merger-related employment terminations. The settlement
payments during 2009 relate to the settlement of liabilities under the SERP for certain executive officers.
The accumulated benefit obligation for all defined-benefit plans was $1.5 billion and $1.4 billion as of
December 31, 2009 and 2008, respectively.
157