Regions Bank 2009 Annual Report Download - page 116
Download and view the complete annual report
Please find page 116 of the 2009 Regions Bank annual report below. You can navigate through the pages in the report by either clicking on the pages listed below, or by using the keyword search tool below to find specific information within the annual report.-
 1
1 -
2
-
3
-
4
-
5
-
6
-
7
-
8
-
9
-
10
-
11
-
12
-
13
-
14
-
15
-
16
-
17
-
18
-
19
-
20
-
21
-
22
-
23
-
24
-
25
-
26
-
27
-
28
-
29
-
30
-
31
-
32
-
33
-
34
-
35
-
36
-
37
-
38
-
39
-
40
-
41
-
42
-
43
-
44
-
45
-
46
-
47
-
48
-
49
-
50
-
51
-
52
-
53
-
54
-
55
-
56
-
57
-
58
-
59
-
60
-
61
-
62
-
63
-
64
-
65
-
66
-
67
-
68
-
69
-
70
-
71
-
72
-
73
-
74
-
75
-
76
-
77
-
78
-
79
-
80
-
81
-
82
-
83
-
84
-
85
-
86
-
87
-
88
-
89
-
90
-
91
-
92
-
93
-
94
-
95
-
96
-
97
-
98
-
99
-
100
-
101
-
102
-
103
-
104
-
105
-
 106
106 -
 107
107 -
 108
108 -
 109
109 -
 110
110 -
 111
111 -
 112
112 -
 113
113 -
 114
114 -
 115
115 -
 116
116 -
 117
117 -
 118
118 -
 119
119 -
 120
120 -
 121
121 -
 122
122 -
 123
123 -
 124
124 -
 125
125 -
 126
126 -
127
-
128
-
129
-
130
-
131
-
132
-
133
-
134
-
135
-
136
-
137
-
138
-
139
-
140
-
141
-
142
-
143
-
144
-
145
-
146
-
147
-
148
-
149
-
150
-
151
-
152
-
153
-
154
-
155
-
156
-
157
-
158
-
159
-
160
-
161
-
162
-
163
-
164
-
165
-
166
-
167
-
168
-
169
-
170
-
171
-
172
-
173
-
174
-
175
-
176
-
177
-
178
-
179
-
180
-
181
-
182
-
183
-
184
-
185
-
186
-
187
-
188
-
189
-
190
-
191
-
192
-
193
-
194
-
195
-
196
-
197
-
198
-
199
-
200
-
201
-
202
-
203
-
204
-
205
-
206
-
207
-
208
-
209
-
210
-
211
-
212
-
213
-
214
-
215
-
216
-
217
-
218
-
219
-
220
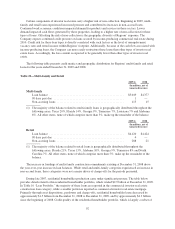
 |
 |
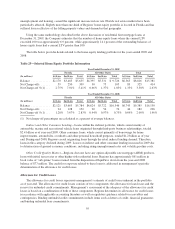
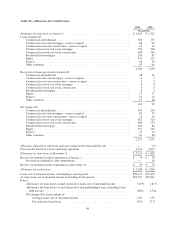
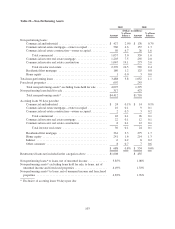
At December 31, 2009, non-performing assets totaled $4.4 billion, or 4.83 percent of ending loans,
compared to $1.7 billion, or 1.76 percent of loans, at December 31, 2008. Non-performing assets, excluding
loans held for sale, increased $2.8 billion to $4.1 billion, or 4.49 percent, compared to $1.3 billion, or 1.33
percent in 2008. The increase in non-performing assets during the year ended December 31, 2009 was primarily
driven by commercial and investor real estate loans, including the residential homebuilder portfolio and
condominium portfolios, due to the continued decline in residential property values. Of the $2.9 billion
residential homebuilder portfolio, approximately $965 million was on non-accrual status and $18 million was 90
days or more past due as of December 31, 2009. Additionally, Regions has recently been experiencing an inflow
of non-performing investor real estate loans secured by income-producing properties, including multi-family and
retail. Of the $5.0 billion multi-family loans, approximately $113 million was on non-accrual status and $1
million was 90 days or more past due as of December 31, 2009. Of the $4.1 billion retail loans, approximately
$288 million was on non-accrual status and $4 million was 90 days or more past due as of December 31, 2009.
Because of the cash flow associated with the income-producing credits, the Company can more easily restructure
these loans. Accordingly, the loss content is expected to be generally lower than other types of investor real
estate.
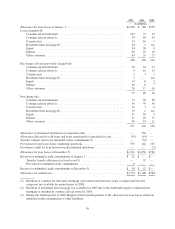
Foreclosed properties, a subset of non-performing assets, totaled $607 million at December 31, 2009 and
$243 million at December 31, 2008, reflecting continued stress on Regions’ loan portfolio. Regions’ foreclosed
properties are composed primarily of a number of small to medium-size properties that are diversified
geographically throughout the franchise. Foreclosed properties are recorded at the lower of the recorded
investment in the loan or fair value less the estimated cost to sell. Table 29 “Non-Performing Assets” presents
information on non-performing loans and foreclosed properties acquired in settlement of loans.
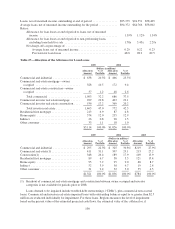
Changes in economic conditions and real estate demand in Regions’ markets are likely to keep the level of
non-performing assets elevated during 2010.
102