Regions Bank 2009 Annual Report Download - page 89
Download and view the complete annual report
Please find page 89 of the 2009 Regions Bank annual report below. You can navigate through the pages in the report by either clicking on the pages listed below, or by using the keyword search tool below to find specific information within the annual report.-
 1
1 -
2
-
3
-
4
-
5
-
6
-
7
-
8
-
9
-
10
-
11
-
12
-
13
-
14
-
15
-
16
-
17
-
18
-
19
-
20
-
21
-
22
-
23
-
24
-
25
-
26
-
27
-
28
-
29
-
30
-
31
-
32
-
33
-
34
-
35
-
36
-
37
-
38
-
39
-
40
-
41
-
42
-
43
-
44
-
45
-
46
-
47
-
48
-
49
-
50
-
51
-
52
-
53
-
54
-
55
-
56
-
57
-
58
-
59
-
60
-
61
-
62
-
63
-
64
-
65
-
66
-
67
-
68
-
69
-
70
-
71
-
72
-
73
-
74
-
75
-
76
-
77
-
78
-
 79
79 -
 80
80 -
 81
81 -
 82
82 -
 83
83 -
 84
84 -
 85
85 -
 86
86 -
 87
87 -
 88
88 -
 89
89 -
 90
90 -
 91
91 -
 92
92 -
 93
93 -
 94
94 -
 95
95 -
 96
96 -
 97
97 -
 98
98 -
 99
99 -
100
-
101
-
102
-
103
-
104
-
105
-
106
-
107
-
108
-
109
-
110
-
111
-
112
-
113
-
114
-
115
-
116
-
117
-
118
-
119
-
120
-
121
-
122
-
123
-
124
-
125
-
126
-
127
-
128
-
129
-
130
-
131
-
132
-
133
-
134
-
135
-
136
-
137
-
138
-
139
-
140
-
141
-
142
-
143
-
144
-
145
-
146
-
147
-
148
-
149
-
150
-
151
-
152
-
153
-
154
-
155
-
156
-
157
-
158
-
159
-
160
-
161
-
162
-
163
-
164
-
165
-
166
-
167
-
168
-
169
-
170
-
171
-
172
-
173
-
174
-
175
-
176
-
177
-
178
-
179
-
180
-
181
-
182
-
183
-
184
-
185
-
186
-
187
-
188
-
189
-
190
-
191
-
192
-
193
-
194
-
195
-
196
-
197
-
198
-
199
-
200
-
201
-
202
-
203
-
204
-
205
-
206
-
207
-
208
-
209
-
210
-
211
-
212
-
213
-
214
-
215
-
216
-
217
-
218
-
219
-
220
 |
 |

commercial, home equity and other consumer loans as discount window collateral. See Note 5 “Loans” to the
consolidated financial statements further detail and discussion of loans pledged to the Federal Reserve Bank at
December 31, 2009 and 2008.
Regions maintains a liability for its brokerage customer position through Morgan Keegan. This liability
represents liquid funds in customers’ brokerage accounts. Balances due to brokerage customers totaled $424
million at December 31, 2009 as compared to $430 million at December 31, 2008. The short-sale liability, which
is primarily maintained at Morgan Keegan in connection with trading obligations related to customer accounts,
was $266 million at December 31, 2009 compared to $629 million at December 31, 2008. The balance of this
account fluctuates frequently based on customer activity.
Other short-term borrowings decreased $42 million to $78 million at December 31, 2009. This balance
includes certain lines of credit that Morgan Keegan maintains with unaffiliated banks and derivative collateral.
The lines of credit had maximum borrowings of $585 million at both December 31, 2009 and December 31,
2008.
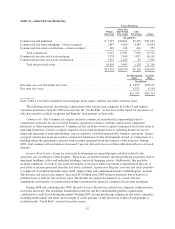
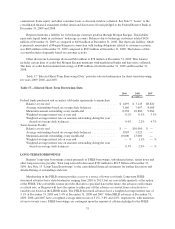
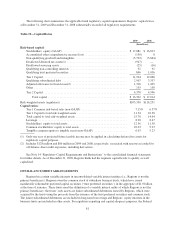
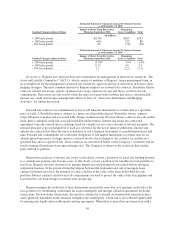
Table 17 “Selected Short-Term Borrowings Data” provides selected information for short-term borrowing
for years 2009, 2008, and 2007.
Table 17—Selected Short-Term Borrowings Data
2009 2008 2007
(In millions)
Federal funds purchased and securities sold under agreements to repurchase:
Balance at year end ............................................. $ 1,893 $ 3,143 $8,820
Average outstanding (based on average daily balances) ................. 3,166 7,697 8,080
Maximum amount outstanding at any month-end ...................... 6,258 10,880 9,984
Weighted-average interest rate at year end ........................... 0.2% 0.5% 3.3%
Weighted-average interest rate on amounts outstanding during the year
(based on average daily balances) ................................ 0.4% 2.2% 4.7%
Term Auction Facility:
Balance at year end ............................................. $ — $10,000 $ —
Average outstanding (based on average daily balances) ................. 3,003 5,925 —
Maximum amount outstanding at any month-end ...................... 10,000 13,000 —
Weighted-average interest rate at year end ........................... — % 1.1% — %
Weighted-average interest rate on amounts outstanding during the year
(based on average daily balances) ................................ 0.3% 2.0% — %
LONG-TERM BORROWINGS
Regions’ long-term borrowings consist primarily of FHLB borrowings, subordinated notes, senior notes and
other long-term notes payable. Total long-term debt decreased $767 million to $18.5 billion at December 31,
2009. See Note 13 “Long-Term Borrowings” to the consolidated financial statements for further discussion and
detailed listing of oustandings and rates.
Membership in the FHLB system provides access to a source of lower-cost funds. Long-term FHLB
structured advances have stated maturities ranging from 2010 to 2013, but are convertible quarterly at the option
of the FHLB. The convertible feature provides that after a specified date in the future, the advances will remain
at a fixed rate, or Regions will have the option to either pay off the advance or convert from a fixed rate to a
variable rate based on the LIBOR index. The FHLB structured advances have a weighted-average interest rate of
3.1% at December 31, 2009 and 5.4% at December 31, 2008 and 2007. Other FHLB advances at December 31,
2009, 2008 and 2007 have a weighted-average interest rate of 3.4%, 3.8% and 4.8%, respectively, with maturities
of one to twenty years. FHLB borrowings are contingent upon the amount of collateral pledged to the FHLB.
75