Regions Bank 2009 Annual Report Download - page 154
Download and view the complete annual report
Please find page 154 of the 2009 Regions Bank annual report below. You can navigate through the pages in the report by either clicking on the pages listed below, or by using the keyword search tool below to find specific information within the annual report.-
 1
1 -
2
-
3
-
4
-
5
-
6
-
7
-
8
-
9
-
10
-
11
-
12
-
13
-
14
-
15
-
16
-
17
-
18
-
19
-
20
-
21
-
22
-
23
-
24
-
25
-
26
-
27
-
28
-
29
-
30
-
31
-
32
-
33
-
34
-
35
-
36
-
37
-
38
-
39
-
40
-
41
-
42
-
43
-
44
-
45
-
46
-
47
-
48
-
49
-
50
-
51
-
52
-
53
-
54
-
55
-
56
-
57
-
58
-
59
-
60
-
61
-
62
-
63
-
64
-
65
-
66
-
67
-
68
-
69
-
70
-
71
-
72
-
73
-
74
-
75
-
76
-
77
-
78
-
79
-
80
-
81
-
82
-
83
-
84
-
85
-
86
-
87
-
88
-
89
-
90
-
91
-
92
-
93
-
94
-
95
-
96
-
97
-
98
-
99
-
100
-
101
-
102
-
103
-
104
-
105
-
106
-
107
-
108
-
109
-
110
-
111
-
112
-
113
-
114
-
115
-
116
-
117
-
118
-
119
-
120
-
121
-
122
-
123
-
124
-
125
-
126
-
127
-
128
-
129
-
130
-
131
-
132
-
133
-
134
-
135
-
136
-
137
-
138
-
139
-
140
-
141
-
142
-
143
-
 144
144 -
 145
145 -
 146
146 -
 147
147 -
 148
148 -
 149
149 -
 150
150 -
 151
151 -
 152
152 -
 153
153 -
 154
154 -
 155
155 -
 156
156 -
 157
157 -
 158
158 -
 159
159 -
 160
160 -
 161
161 -
 162
162 -
 163
163 -
 164
164 -
165
-
166
-
167
-
168
-
169
-
170
-
171
-
172
-
173
-
174
-
175
-
176
-
177
-
178
-
179
-
180
-
181
-
182
-
183
-
184
-
185
-
186
-
187
-
188
-
189
-
190
-
191
-
192
-
193
-
194
-
195
-
196
-
197
-
198
-
199
-
200
-
201
-
202
-
203
-
204
-
205
-
206
-
207
-
208
-
209
-
210
-
211
-
212
-
213
-
214
-
215
-
216
-
217
-
218
-
219
-
220
 |
 |

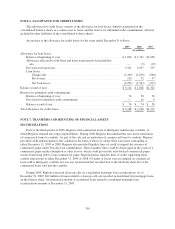
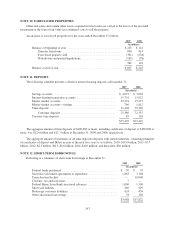
The sensitivity calculations above are hypothetical and should not be considered to be predictive of future
performance. Changes in fair value based on adverse changes in assumptions generally cannot be extrapolated
because the relationship of the change in assumption to the change in fair value may not be linear. Also, the
effect of an adverse variation in a particular assumption on the fair value of the mortgage servicing rights is
calculated without changing any other assumption, while in reality changes in one factor may result in changes in
another which may either magnify or counteract the effect of the change. The derivative instruments utilized by
Regions would serve to reduce the estimated impacts to fair value included in the table above.
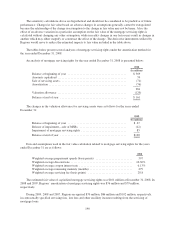
The tables below present several analyses of mortgage servicing rights under the amortization method for
the year ended December 31, 2008.
An analysis of mortgage servicing rights for the year ended December 31, 2008 is presented below:
2008
(In millions)
Balance at beginning of year ........................................ $369
Amounts capitalized ............................................... 59
Sale of servicing assets ............................................. (71)
Amortization ..................................................... (76)
281
Valuation allowance ............................................... (120)
Balance at end of year ............................................. $161
The changes in the valuation allowance for servicing assets were as follows for the years ended
December 31:
2008
(In millions)
Balance at beginning of year ........................................ $ 47
Release of impairment—sale of MSRs ................................ (12)
Impairment of mortgage servicing rights ............................... 85
Balance at end of year ............................................. $120
Data and assumptions used in the fair value calculation related to mortgage servicing rights for the years
ended December 31 are as follows:
2008
Weighted-average prepayment speeds (basis points) ......................... 597
Weighted-average discount rate .......................................... 10.30%
Weighted-average coupon interest rate .................................... 6.13%
Weighted-average remaining maturity (months) ............................. 279
Weighted-average servicing fee (basis points) .............................. 28.8
The estimated fair value of capitalized mortgage servicing rights was $161 million at December 31, 2008. In
2008 and 2007, Regions’ amortization of mortgage servicing rights was $76 million and $79 million,
respectively.
During 2009, 2008 and 2007, Regions recognized $70 million, $86 million and $102 million, respectively,
in contractually specified servicing fees, late fees and other ancillary income resulting from the servicing of
mortgage loans.
140