Regions Bank 2009 Annual Report Download - page 168
Download and view the complete annual report
Please find page 168 of the 2009 Regions Bank annual report below. You can navigate through the pages in the report by either clicking on the pages listed below, or by using the keyword search tool below to find specific information within the annual report.-
 1
1 -
2
-
3
-
4
-
5
-
6
-
7
-
8
-
9
-
10
-
11
-
12
-
13
-
14
-
15
-
16
-
17
-
18
-
19
-
20
-
21
-
22
-
23
-
24
-
25
-
26
-
27
-
28
-
29
-
30
-
31
-
32
-
33
-
34
-
35
-
36
-
37
-
38
-
39
-
40
-
41
-
42
-
43
-
44
-
45
-
46
-
47
-
48
-
49
-
50
-
51
-
52
-
53
-
54
-
55
-
56
-
57
-
58
-
59
-
60
-
61
-
62
-
63
-
64
-
65
-
66
-
67
-
68
-
69
-
70
-
71
-
72
-
73
-
74
-
75
-
76
-
77
-
78
-
79
-
80
-
81
-
82
-
83
-
84
-
85
-
86
-
87
-
88
-
89
-
90
-
91
-
92
-
93
-
94
-
95
-
96
-
97
-
98
-
99
-
100
-
101
-
102
-
103
-
104
-
105
-
106
-
107
-
108
-
109
-
110
-
111
-
112
-
113
-
114
-
115
-
116
-
117
-
118
-
119
-
120
-
121
-
122
-
123
-
124
-
125
-
126
-
127
-
128
-
129
-
130
-
131
-
132
-
133
-
134
-
135
-
136
-
137
-
138
-
139
-
140
-
141
-
142
-
143
-
144
-
145
-
146
-
147
-
148
-
149
-
150
-
151
-
152
-
153
-
154
-
155
-
156
-
157
-
 158
158 -
 159
159 -
 160
160 -
 161
161 -
 162
162 -
 163
163 -
 164
164 -
 165
165 -
 166
166 -
 167
167 -
 168
168 -
 169
169 -
 170
170 -
 171
171 -
 172
172 -
 173
173 -
 174
174 -
 175
175 -
 176
176 -
 177
177 -
 178
178 -
179
-
180
-
181
-
182
-
183
-
184
-
185
-
186
-
187
-
188
-
189
-
190
-
191
-
192
-
193
-
194
-
195
-
196
-
197
-
198
-
199
-
200
-
201
-
202
-
203
-
204
-
205
-
206
-
207
-
208
-
209
-
210
-
211
-
212
-
213
-
214
-
215
-
216
-
217
-
218
-
219
-
220
 |
 |

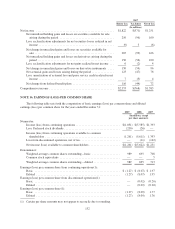
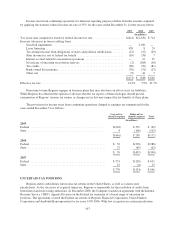
The following table summarizes the elements of compensation costs recognized in the consolidated
statements of operations for the years ended December 31:
2009 2008 2007
(In millions)
Compensation cost of share-based compensation awards:
Restricted stock awards and units ................................ $33 $50 $63
Stock options ................................................ 14 16 13
Tax benefits related to compensation cost ............................. (17) (24) (29)
Compensation cost of share-based compensation awards, net of tax ......... $30 $42 $47
The following table summarizes the weighted-average assumptions used and the weighted-average
estimated fair values related to stock options granted during the years ended December 31:
2009 2008 2007
Expected dividend yield ....................................... 1.8% 6.9% 4.1%
Expected volatility ........................................... 67.2% 26.4% 19.7%
Risk-free interest rate ......................................... 2.8% 2.9% 4.5%
Expected option life .......................................... 6.8yrs. 5.8 yrs. 5.0 yrs.
Fair value .................................................. $1.79 $2.46 $5.23
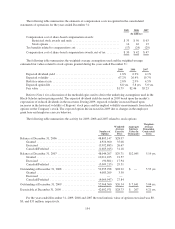
Refer to Note 1 for a discussion of the methodologies used to derive the underlying assumptions used in the
Black-Scholes option pricing model. The expected dividend yield decreased in 2009 based upon the market’s
expectation of reduced dividends in the near term. During 2009, expected volatility increased based upon
increases in the historical volatility of Regions’ stock price and the implied volatility measurements from traded
options on the Company’s stock. The expected option life increased in 2009 due to changes in the employee
grant base and employee exercise behavior.
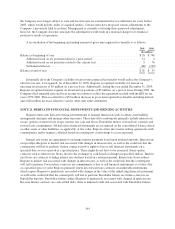
The following table summarizes the activity for 2009, 2008 and 2007 related to stock options:
Number of
Options
Weighted-
Average
Exercise
Price
Aggregate
Intrinsic
Value (In
Thousands)
Weighted-
Average
Remaining
Contractual
Term
Balance at December 31, 2006 .......................... 48,805,147 $28.97
Granted ........................................ 4,916,960 35.08
Exercised ...................................... (3,992,885) 26.67
Canceled/Forfeited ............................... (1,685,015) 31.18
Balance at December 31, 2007 .......................... 48,044,207 $29.71 $12,045 5.19 yrs.
Granted ........................................ 10,011,105 21.57
Exercised ...................................... (90,801) 17.94
Canceled/Forfeited ............................... (5,009,213) 29.51
Outstanding at December 31, 2008 ...................... 52,955,298 $28.22 $ — 5.53 yrs.
Granted ........................................ 4,083,209 3.30
Exercised ...................................... — —
Canceled/Forfeited ............................... (4,069,947) 27.84
Outstanding at December 31, 2009 ...................... 52,968,560 $26.34 $ 7,641 5.04 yrs.
Exercisable at December 31, 2009 ....................... 42,602,971 $28.73 $ 267 4.21 yrs.
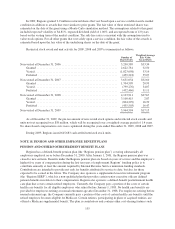
For the years ended December 31, 2009, 2008 and 2007 the total intrinsic value of options exercised was $0,
$0, and $33 million, respectively.
154